Architecture and Integration: ISA-95, OT/IT, and the Edge-to-Cloud Path
📍 Where we are: Chapter 6 named the information systems that each own a slice of plant data; this chapter shows the architecture that stacks them into one coherent whole — from the lowest sensor to the cloud.
In the last chapter we met the cast of systems that run a biomanufacturing plant: the historian (which records every time-stamped sensor reading), the MES (Manufacturing Execution System, which drives the step-by-step batch record), the LIMS (Laboratory Information Management System, which holds quality-control test results), and the ELN (Electronic Laboratory Notebook, where scientists record experiments). Each owns its own data, and between them lie integration seams — the places where one system must hand data to another. Where the seams leak, you get data silos: islands of information that never talk to each other.
This chapter is about the floor plan that organizes those systems. Just as a building has a structural blueprint, a factory's computers and machines follow a reference architecture — an agreed map of layers, who sits where, and how information moves between them.
Think of a tall office building. The lobby and loading dock (the factory floor) handle the physical work. The middle floors coordinate the day's jobs. The top floor is the executive suite, planning weeks ahead. Information rides the elevator up as reports, and instructions ride down as orders. The reference architecture in this chapter is the building code that specifies which function belongs on which floor — and which elevators are allowed to stop where — the rules that keep the building both safe and efficient.
What this chapter covers
We start with the classic layered map of an automated plant, then explain the cultural clash between the two worlds it joins, the translation layer that turns raw signals into meaning, the modern path that carries data from the machine edge all the way to the cloud, and the storage and security choices that decide whether the resulting data shadow — the full digital record every batch casts as it is made — stays trustworthy.
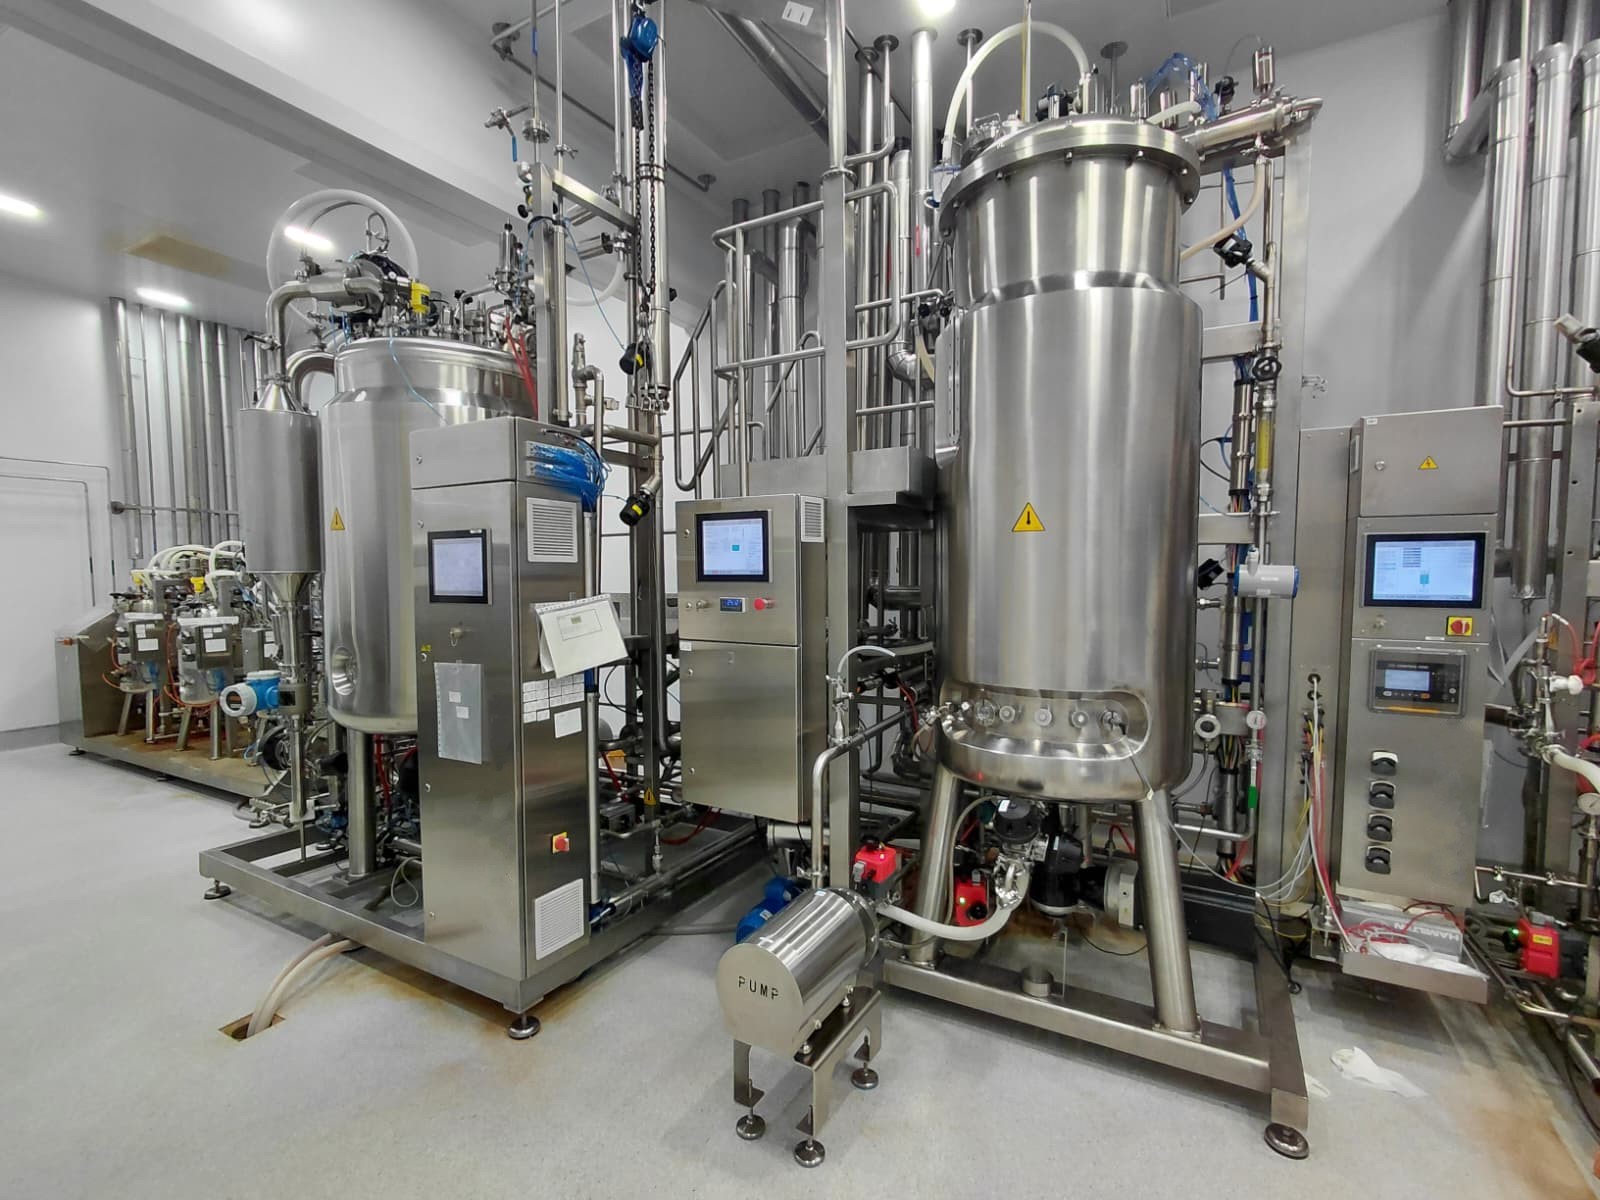
An integrated upstream/downstream plant. Physically one facility; in data terms, a layered architecture from field sensors up to enterprise systems.
Integrated USP/DSP plant. "USP DSP Plant" by CC1984USA, licensed under CC BY-SA 4.0 (https://creativecommons.org/licenses/by-sa/4.0/), via Wikimedia Commons; used unmodified. This image is licensed under CC BY-SA 4.0 and may be reused under the same license; this license applies to the image only, not to the rest of this book.

The ISA-95 / Purdue hierarchy: data flows up, commands flow down, and OT meets IT.
Original diagram by the authors, created with AI assistance.
The layered map: Purdue and ISA-95
We met the Purdue/ISA-95 levels briefly in Chapter 5; here we unfold all five. In 1994, Theodore Williams and colleagues at Purdue University formalized a way to describe any large industrial enterprise as a stack of layers — the Purdue Enterprise Reference Architecture, usually shortened to the Purdue model [1]. That model became the backbone of the international standard ISA-95 (also published as IEC 62264), which defines how the systems that control a factory connect to the systems that run the business [2].
Levels 0-2: the operational floor
The bottom three levels are where the physical work happens — the part of the plant you can hear and smell. They map directly onto the manufacturing steps in the companion book: when a recipe drives the production bioreactor, the agitator, gas spargers, and feed pumps it commands all live here, and the probes bolted to that vessel are the Level 0 instruments.
ISA-95 organizes a plant into five numbered levels [2]:
- Level 0 — the physical process and its field instruments. The physical reality: the bioreactor itself, its broth, its valves and pumps, plus the probes and sensors bolted to it. This is the molecule being made and the instrumentation that touches it — a pH probe measures, a valve or pump acts.
- Level 1 — basic control. The control function that reads those field instruments and commands them, second by second. Here lives the PLC (Programmable Logic Controller, a rugged industrial computer) — for example a Rockwell Allen-Bradley CompactLogix or a Siemens SIMATIC controller programmed in TIA Portal: it reads a pH probe and drives a pump to hold a setpoint. This is the regulatory-control layer that touches the process moment by moment.
- Level 2 — supervisory control. The automation an operator watches and steers across the whole unit. Here live the SCADA systems (Supervisory Control and Data Acquisition) and HMIs (Human-Machine Interfaces) shown on screen; a DCS (Distributed Control System) — such as the ABB Ability System 800xA or Emerson DeltaV widely used in biopharma — typically spans Levels 1-2, combining basic and supervisory control in one platform.
Levels 3-4: the information layer
Above the operational floor sits the world of records and plans. These two levels do not touch a valve; they reason about what the floor did and what it should do next.
- Level 3 — manufacturing operations. The plant-coordination floor: the MES (for example Siemens Opcenter/SIMATIC IT, Rockwell FactoryTalk PharmaSuite, or Dassault Systèmes Apriso), the historian (such as AVEVA/OSIsoft PI System, AVEVA Historian (formerly Wonderware Historian), Aspen InfoPlus.21, or Honeywell PHD), and the LIMS (for example LabWare LIMS, Thermo Scientific SampleManager, or Benchling) from Chapter 6 live here, scheduling work and assembling the batch record. Level 3 is also where lab results enter the architecture: when an analyst runs a release assay during analytical and formulation development, the LIMS record they create lands at this level.
- Level 4 — enterprise. The business systems — ERP (Enterprise Resource Planning, which handles orders, inventory, and finance) — that plan production weeks and months ahead.
A complementary standard, ISA-88 (IEC 61512), refines the picture for batch manufacturing — the dominant mode in biopharma, where one defined quantity of product is made at a time. ISA-88 breaks the physical plant into a tidy hierarchy — process cell, unit, equipment module, control module — and separates the recipe (what to make) from the equipment (what makes it) [7] — and on the recipe side it breaks each batch procedure into ordered steps called phases (for example a Charge phase, then Production, then Harvest), the smallest unit of process action a recipe commands. That separation is why the same bioreactor can run a recipe today and a different one tomorrow.
The crucial idea is direction of flow. Data flows up: a pH reading from a probe at Level 0 is acquired by the controller at Level 1, becomes a trend in the historian at Level 3, and finally a yield report at Level 4. Commands flow down: a production order at Level 4 becomes a scheduled batch at Level 3, a recipe and supervisory action at Level 2, a setpoint enforced by the controller at Level 1, and finally a valve opening on the equipment at Level 0.
The same five levels carry the downstream (purification) train, not just the upstream bioreactor. When the Protein A capture step — the affinity-chromatography step that pulls the antibody out of the clarified harvest — runs its four-phase load/wash/elute/clean cycle, the chromatography skid's UV280 detector, conductivity probe, and pH probe are Level 0 instruments; the skid PLC sequencing the phases is Level 1; the column-management SCADA an operator watches is Level 2; and the elution-pool volume, peak start/stop, and the low-pH viral-inactivation hold that follows — the brief acid step (around pH 3.5, held for a defined time) that the companion book covers in viral inactivation — are recorded as a phase in the MES batch record at Level 3. A downstream pH = 3.5 reading is architecturally identical to an upstream FeedFlow = 12.4: a Level 0 number that means nothing until the stack stamps it with which step, which column, which hold timer, which batch. The ISA-88 phase model is what lets the same architecture describe a fed-batch bioreactor Production phase and a chromatography Elute phase with one vocabulary.
The hero figure above shows that flow. The five levels, with the systems that live at each and which world they belong to:
| Level | What it does | Example systems | OT / IT |
|---|---|---|---|
| 4 — Enterprise | Plan production weeks and months ahead | ERP — orders, inventory, finance | IT |
| 3 — Operations | Schedule work, assemble the batch record | MES (Opcenter, FactoryTalk PharmaSuite, Apriso), Historian (PI, InfoPlus.21, PHD), LIMS (LabWare, SampleManager, Benchling) | IT |
| 2 — Supervisory control | Operator watches and steers the unit | SCADA, HMI, DCS (ABB 800xA, Emerson DeltaV) | OT |
| 1 — Basic control | Read instruments and command them second by second | PLC (Allen-Bradley CompactLogix, Siemens SIMATIC), controllers, DCS | OT |
| 0 — Process & field | The physical process and the probes that touch it | Bioreactor, broth, valves, pumps, pH probes | OT |
The OT/IT seam — the security boundary with its DMZ and zones-and-conduits — sits between Levels 2 and 3: below it, OT prioritizes availability and safety; above it, IT prioritizes confidentiality.
Two worlds that must meet: OT and IT
The lower levels (0 through 2) form the world of OT — Operational Technology: the computers that directly run physical equipment. The upper levels (3 and 4) are IT — Information Technology: the ordinary world of databases, networks, and laptops. These two worlds grew up with opposite priorities, and that difference is the central tension of plant architecture.
IT and OT both care about the CIA triad — confidentiality, integrity, availability — but they emphasize its members differently. IT teams typically prioritize confidentiality first: keep the data secret. OT typically reverses the emphasis, putting availability first, and adds safety as an overriding concern that sits outside the triad altogether [3]. A control system that pauses for a software update could ruin a two-week cell culture or, worse, create a hazard. An OT engineer may decline a routine patch that an IT administrator considers mandatory — and both are justified within their operational and regulatory logic.
Bringing these worlds together is called OT/IT convergence, and a growing research literature treats it as one of the defining challenges of industrial digitalization: the systems must connect for data to flow, yet their cultures, lifecycles, and risk models pull apart [5].
The OT/IT boundary: zones, conduits, and the DMZ
The standard architectural answer is to not let the two worlds touch directly. Between the OT levels and the IT levels sits a DMZ (demilitarized zone) — a buffer network where carefully chosen data can be exchanged without exposing the control systems to the open enterprise network. This zones-and-conduits approach — grouping equipment into security zones and allowing traffic only through defined conduits — is formalized across the IEC 62443 family of standards, which together define seven foundational security requirements, a zones-and-conduits model, and graded security levels for industrial networks. Within that family, IEC 62443-3-3 sets out the detailed system requirements and the security levels derived from those foundations [4]. The U.S. NIST SP 800-82 guide gives parallel, widely cited guidance on segmenting OT networks and the topologies that keep them safe [3].
Segmentation is an architecture decision, not a bolt-on. If you wait until a plant is built to think about zones and DMZs, retrofitting them is painful and often incomplete. Security boundaries belong on the blueprint.
The unsolved part: retrofitting security boundaries into pre-ISA-95 plants
The clean zones-and-conduits diagram assumes you are designing a plant from scratch. Most biomanufacturing sites are not. They were built before the modern OT/IT threat model existed, with control networks that were "secure" only because they were physically isolated — an assumption that evaporated the moment someone needed a historian feed in the corporate cloud. Retrofitting a DMZ and proper segmentation into a running plant is genuinely hard, and it remains an open problem rather than a solved one.
The difficulty is structural, not merely technical. NIST SP 800-82 lays out the target topology — segmented zones, a DMZ between OT and IT, conduits that carry only the traffic that must cross — but it also makes clear that imposing that topology after the fact means re-architecting live networks that cannot be taken down without halting production [3]. IEC 62443 grades each zone to a target security level, yet a brownfield plant typically contains decades of accreted equipment whose protocols predate authentication entirely, so the achievable level is dragged down to its weakest member [4]. The result is architectural debt: post-facto segmentation is expensive, frequently left incomplete because the last few legacy links are too risky to touch, and the recent OT/IT convergence literature documents this as a widespread pattern — flat networks, over-broad firewall rules, and DMZs that exist on the diagram but are bypassed in practice [5]. There is no clean migration recipe; each plant pays down its debt incrementally, and the seam between "what the standard wants" and "what the floor can bear" is where much real-world security work lives. The open-source path explores one slice of this in legacy skids and Modbus/S7 integration, where the pre-ISA-95 equipment itself is the constraint.
From raw tags to meaning: the contextualization layer
A sensor does not emit knowledge; it emits a tag — a cryptic name and a number, like FIC_204.PV = 12.4. By itself that is meaningless. It only becomes information when you know it is the feed flow rate, in litres per hour, for Bioreactor 2, during batch B-2207, in the production suite. Adding that surrounding meaning is called contextualization, and the layer that does it is the connective tissue of a modern plant [5].
The workhorse protocol that carries data across these levels is OPC UA (Open Platform Communications Unified Architecture, standardized as the IEC 62541 series), which moves data with a typed, self-describing information model rather than as bare numbers — the default connectivity layer in most modern plants. Although it is most often invoked at the Level 2-to-Level 3 seam, OPC UA is not confined there: it spans Levels 1 through 3, from a field-bus-adjacent controller exposing its variables as an address space, through supervisory aggregation, up to the operations systems that subscribe to it. Its newer extensions widen that reach further. OPC UA PubSub adds a native publish-subscribe transport (each source publishes once and many consumers subscribe to what they need — the pattern is unpacked under the Unified Namespace below) — over MQTT or over UDP multicast — so the protocol no longer depends on point-to-point client-server sessions and can feed a Unified Namespace directly. OPC UA FX (Field eXchange) extends the same information model down into controller-to-controller communication at Levels 1-2, the territory that historically belonged to proprietary field buses, with deterministic delivery over Time-Sensitive Networking (TSN). Together these mean one self-describing model can run from the field device to the enterprise. The companion volume dissects exactly what one such reading carries on the wire in OPC UA and MQTT connectivity; the next chapter, Connectivity and Interoperability Standards, surveys the wider family of languages.
UNS and Sparkplug B: the publish-subscribe meeting point
A popular pattern here is the UNS — Unified Namespace: a single, organized, real-time map of the whole plant where every piece of data lives at a meaningful address (for example, Enterprise/Site/Suite/Bioreactor2/FeedFlow). Instead of each system asking every other system for data point-to-point — the tangle that creates silos — every system publishes its data to the namespace and subscribes to what it needs. The open-source companion shows how this addressing scheme is built in practice in naming and the Unified Namespace. This publish-subscribe wiring is typically carried by a message broker using the lightweight MQTT protocol, often with the Sparkplug specification, which adds a standard structure for industrial topics and payloads so that subscribers know exactly how to interpret what arrives [6]. A Sparkplug topic and birth payload for that same feed-flow tag might look like this:
// Topic: spBv1.0/Site1/DBIRTH/PLC1/BR2
{
  "timestamp": 1718308800000,
  "metrics": [
    {
      "name": "Suite/Bioreactor2/FeedFlow",
      "alias": 204,
      "timestamp": 1718308800000,
      "dataType": "Float",
      "value": 12.4,
      "properties": {
        "engUnit": { "type": "String", "value": "L/h" },
        "batchId": { "type": "String", "value": "B-2207" }
      }
    }
  ],
  "seq": 1
}
In Sparkplug B the seq field is a rolling per-message counter that starts at 0 on the NBIRTH (Node BIRTH, the node-level message that opens an edge node's session) and increments with every message after it, wrapping from 255 back to 0; a subscriber that sees a gap knows it missed a message. So the NBIRTH carries seq 0 and this following DBIRTH (Device BIRTH, one per device under that node) carries seq 1. A separate bdSeq (birth/death sequence) number, set in the NBIRTH and echoed in the matching NDEATH (Node DEATH) — a death message the client pre-registers as the broker's MQTT Last Will, which the broker publishes automatically if the connection drops uncleanly — lets the broker and subscribers pair a clean disconnect with the session it ended, distinguishing an orderly node restart from a stale, never-closed session. The two counters answer different questions: seq proves message-level continuity within a session; bdSeq proves session-level identity across reconnects [6].
B-2207 in the payload above is a deliberately separate B2MML worked example used throughout this chapter's connectivity snippets; it is not the book's running batch (BATCH-2026-001) and is left distinct on purpose so the wire-format example and the contextualization example never blur together.
The same reading, landed in the historian as a bare row, is just the six raw columns the collector wrote — the raw band that the contextualization layer will later carry through unchanged:
ts,tag,value,unit,quality,batch_id
2024-06-13T20:00:00Z,FIC_204.PV,12.4,L/h,Good,B-2207
These are exactly the six fields the open-source companion stores, and exactly the raw band the anatomy card below carries through. The quality field — shown decoded here as Good — is the source's quality stamp travelling beside the value so an uncertain point is never silently averaged in. On a modern OPC UA source, Good is the StatusCode value 0; on the legacy OPC DA sources many brownfield plants still run, Good is the quality byte 192 (with 64 Uncertain and 0 Bad). The two encodings collide on the value 0, which is exactly why the contextualization layer normalizes them before storing.
A related but distinct idea is the data fabric — not a synonym for the UNS or the broker, but an architectural approach that provides a unified, integrated access layer over many scattered sources, weaving them into one queryable whole. A UNS can be one way to feed such a fabric.
A newer organizational pattern, the data mesh, comes at the same problem from the opposite direction. Where a data fabric centralizes integration into one technical layer, a data mesh decentralizes ownership: each domain — upstream, downstream, QC — treats its data as a product, owning its quality, documentation, and access, while a thin federated-governance layer enforces shared standards so the products interoperate. In a biomanufacturing plant the appeal is concrete: the upstream team understands its bioreactor tags far better than a central data office ever could, so making them the accountable owners of a well-described upstream data product tends to beat funnelling everything through one overloaded integration team. Fabric and mesh are not rivals so much as two answers to the same question — how do scattered sources become one trustworthy whole — one emphasizing a unified technical layer, the other distributed product ownership; large plants often blend them.
The Unified Namespace does not replace the historian, MES, or LIMS from Chapter 6. It sits beside them as a shared, real-time meeting point, so each system can contribute and consume data without bespoke point-to-point links.
Anatomy of a contextualized reading
The CSV row above is a flattened preview; the architecture's real product is a richer record. It is worth dissecting that record field by field, because it is the data-level artifact this whole stack exists to produce — and it is the exact thing the open-source companion materializes as a database view. In the historian, our feed-flow reading is just six bare columns. Once the contextualization layer has done its work, the same reading becomes one row with eleven fields that fall into four meaningful bands: a raw band (the six historian columns carried through unchanged), a batch band (three columns joined in from the batch record — what is being made, under which recipe, on which equipment), a phase band (the two columns that did not exist anywhere until the join manufactured them, naming the ISA-88 phase the reading fell inside), and a tag decode that unpacks the cryptic name FIC_204.PV into its asset, measurement, and role.

One contextualized reading, field by field: six raw historian columns, three joined from the batch, the two phase columns a temporal join derives, and the relationships that tie the row to the rest of the plant model.
Original diagram by the authors, created with AI assistance.
The most valuable field on that card is the one that was never measured: phase_name = Production. A historian stores a number at a time; this row knows it is a Production-phase reading. That single derived field is what lets a Level 4 query ask a human question — "what was the feed flow during the Production phase of B-2207?" — and get an answer. The open-source companion builds exactly this record as a PostgreSQL view, s88.v_batch_sensor, and derives the phase band with a temporal-containment join from the reading's timestamp to the ISA-88 phase windows; the full mechanism, column by column, is the subject of its contextualization chapter. The card here is the concept; that chapter is the running code.
The same row as a semantic triple
A relational row is one way to carry that context; a knowledge graph carries the same facts as explicit relationships a machine can reason over. The ontology companion models this reading as RDF (Resource Description Framework, the graph data model whose atom is the subject–predicate–object triple). Written in Turtle (the text syntax for RDF), the contextualized reading becomes a handful of triples that say the same thing the eleven-field row says — but with every value carrying its unit and every link an edge you can walk:
# One contextualized reading as RDF — the row's fields become typed triples.
bp:reading-FIC204-0001 a bp:SensorReading ;
    bp:ofTag        "FIC_204.PV" ;
    bp:occurredIn   bp:BR2 ;            # occursIn → the vessel (aligns to BFO occurs in)
    bp:duringPhase  bp:PH3-Production ; # the derived phase band, now an edge
    bp:partOfBatch  bp:B-2207 ;
    bp:hasValue     [ a qudt:QuantityValue ;
                      qudt:numericValue "12.4"^^xsd:float ;
                      qudt:hasUnit unit:L-PER-HR ] .   # value never travels bare
Two of the page's own concepts are now formal. The unit:L-PER-HR IRI is the ontology answer to the same problem the unit column and the Sparkplug engUnit solve on the wire — a QUDT (Quantities, Units, Dimensions and Types) unit so 12.4 can never be misread as some other rate; the ontology book works this typed-value discipline in identifiers and units. And bp:duringPhase and bp:partOfBatch are object properties — edges, not strings — so the genealogy the contextualization chapter joins by timestamp becomes a graph you can traverse, the spine the ontology book builds in relations and genealogy.
The closed-world question this chapter's contextualization layer must guarantee — every stored reading carries a unit, a batch, and a phase, exactly once — is a SHACL (Shapes Constraint Language) shape, the graph counterpart of a NOT NULL constraint on the view. SHACL validates that required facts are present, which is precisely what OPC UA's quality code and the contextualization join cannot themselves enforce:
# shapes.ttl — a stored reading must be fully contextualized, or it fails validation.
bp:ContextualizedReadingShape a sh:NodeShape ;
    sh:targetClass bp:SensorReading ;
    sh:property [ sh:path bp:partOfBatch ; sh:minCount 1 ; sh:maxCount 1 ] ;
    sh:property [ sh:path bp:duringPhase ; sh:minCount 1 ] ;
    sh:property [ sh:path bp:hasValue    ; sh:minCount 1 ;
                  sh:message "Reading stored without a unit-qualified value." ] .
And the "human question" the anatomy card celebrated — what was the feed flow during the Production phase of B-2207? — is a competency question (a plain-language question the data model must be able to answer, used as a pass/fail acceptance test), answered by one SPARQL (the standard query language for RDF) query that walks exactly the edges the triples above declare:
# CQ: feed flow during the Production phase of batch B-2207.
SELECT ?value WHERE {
  ?r bp:partOfBatch bp:B-2207 ; bp:duringPhase bp:PH3-Production ;
     bp:ofTag "FIC_204.PV" ; bp:hasValue [ qudt:numericValue ?value ] .
}
The relational view and the graph are not rivals — they are two surfaces over the one contextualized fact, and the ontology companion grounds the same architecture under the FAIR lens in ontologies and FAIR.
From raw tag to contextualized row: the journey through the stack
It helps to watch a single reading climb. The feed-flow value is born at Level 1 as an OPC UA node — a value, a quality flag, and a timestamp read by the PLC. At Level 2 it is stamped with the active batch_id and published into the UNS over MQTT/Sparkplug B. It crosses the OT/IT boundary through a DMZ conduit — an edge gateway curating which data is allowed up while low-latency control stays below. It lands at Level 3 as six raw historian columns, gains its batch and phase context to become the eleven-field v_batch_sensor row, and finally answers a batch-aware query at Level 4. The same physical reading, the same number, but at each layer it carries more meaning.

A reading's journey: data flows up the levels, crosses the OT/IT boundary through the DMZ, and accrues context until it is a record a person can query.
Original diagram by the authors, created with AI assistance.
The open-source companion follows this same path from the other end: its upstream bioreactor chapter starts at the Level 1 source, and its contextualization chapter assembles the Level 3 row this figure ends on.
Edge to cloud: where the computing happens
The last architectural question is where the data is processed. Two answers, used together, define the modern pattern.
Edge computing means processing data right next to the equipment that produces it. This matters for PAT — the Process Analytical Technology framework from Chapter 4, whose real-time, in-line measurements feed control decisions during the run. When a measurement must drive a correction on the spot — say a Level 1 controller holding a pH or dissolved-oxygen setpoint — sending the reading to a distant data center and waiting for a reply is far too slow for time-critical control. Low-latency control belongs at the edge.
Cloud computing means processing and storing data in large, remote, elastic data centers. This is ideal for the opposite job: pooling years of batch data into a data lake (a vast store of raw and processed data), training analytics and machine-learning models across many runs, and keeping records for the long retention periods that regulators require.
Real plants therefore run a hybrid architecture: fast, deterministic decisions at the edge; heavy analytics and durable storage in the cloud; the contextualization layer streaming curated data upward between them.
The analytical-storage tier: time-series databases and the lakehouse
Once the curated stream reaches the cloud, where it lands shapes what you can do with it. Two storage shapes dominate, and they answer different questions.
A time-series database (TSDB) — InfluxDB, TimescaleDB, or the historian's own engine — is built for the question every operator asks first: what did this tag do over this window? It indexes by tag and time, compresses long flat runs of near-constant values aggressively, and answers a "last 24 hours of BR101.Temp.PV" query in milliseconds. It is the natural home of the hot, recent, operational data.
A lakehouse answers the opposite question — what happened across hundreds of batches, joined to their genealogy and QC results? — and it does so by storing trajectory data in columnar Parquet files governed by an open table format such as Delta Lake or Apache Iceberg. Columnar layout is the key: a bioreactor trajectory is millions of rows but only a handful of columns, so reading just value and ts for one tag across a year touches a thin slice of disk instead of the whole table, and a column of near-identical floats compresses to a fraction of its raw size. Delta and Iceberg add what raw Parquet lacks — ACID transactions, schema evolution, and time travel (querying the table as it stood on a past date) — which is precisely what turns a passive file dump into an auditable analytical store. The lakehouse is where the years of pooled batch data live, and where a machine-learning model reads its training set.
Why the architecture decides whether a model can be trusted
A model is only as honest as the way its training set was assembled from this lakehouse, and two architectural facts above quietly govern that. The first is the batch_id the contextualization layer stamps on every reading. Without it, a careless split of the pooled data puts readings from the same batch into both the training and the test set — data leakage that lets the model memorize a batch instead of learning the process, so its reported accuracy is a flattering fiction. The cure is grouped cross-validation (also called leave-one-batch-out: every reading from one batch is held out together, so the model is always scored on a batch it has never seen) — and it is only possible because batch_id rode up the stack with the value. The ML companion makes this the first rule of honest evaluation in data, the fuel and models and validation.
The second is drift. The edge-to-cloud path streams a moving target: a Raman probe slowly fouls, a raw-material lot shifts, a campaign runs a fraction warmer — so the input distribution a model was trained on quietly diverges from the one it now sees (covariate shift, the input distribution moving), and eventually the relationship itself can change (concept drift, the same input implying a different answer). Both are detectable only because the architecture preserved the contextualized history a detector can compare against. This is the load-bearing distinction this book draws: process drift is the living system genuinely changing and is a manufacturing event; model drift is the model going stale relative to that change and is a data event — and the applicability domain (the input region where the model was actually calibrated and can be trusted) is the line between them. A reading whose tag, batch, and phase context place it outside that region is one the model should refuse to score rather than extrapolate into. The ML companion builds the drift detectors and the locked-then-relearn governance this implies in MLOps and lifecycle.
This long-retention cloud tier is not just convenient; it is where two of the ALCOA+ data-integrity attributes are physically realized — ALCOA+ being the regulators' data-integrity checklist that records be Attributable, Legible, Contemporaneous, Original, and Accurate, plus Complete, Consistent, Enduring, and Available (the full set is treated in data governance). Enduring — records must survive for the full required retention period, often the product lifecycle plus years — is satisfied by durable, replicated cloud object storage that outlives any single server. Available — records must be retrievable throughout that period — is satisfied by the lakehouse's indexed, queryable Parquet rather than tapes in a vault no one can read. The architectural choice of storage tier is therefore also a compliance choice: a cheap archive that cannot be queried fails Available, and a fast cache that is purged after ninety days fails Enduring. The retention and integrity expectations behind these attributes are spelled out in the lifecycle of a data point and data governance.
A parallel that biopharma engineers will recognize is NOA — NAMUR Open Architecture, a reference model from the NAMUR process-industry user association. NOA's core idea is a second channel: alongside the tightly validated core automation pyramid (Levels 1-3, which must stay closed and deterministic), NOA defines a separate, read-mostly path that taps the same process data for monitoring and optimization — exactly the analytics that belong in the cloud — without touching the control loop. It is, in effect, a sanctioned way to get OT data to IT analytics through a one-way diode rather than by drilling a hole in the control network, and it dovetails with the zones-and-conduits discipline above: the optimization channel is its own zone, with a conduit that only ever flows data outward.
Cybersecurity: the attack surface is a data-integrity surface
It is tempting to file security under IT housekeeping, but in a GMP (Good Manufacturing Practice) plant every boundary this chapter has drawn is also a data-integrity boundary, and an attacker who crosses it does not merely steal data — they can change it, which is the one thing the whole regulatory edifice exists to prevent. The moment isolated control networks were opened so a historian feed could reach the cloud, the OT/IT boundary stopped being a convenience seam and became the plant's primary attack surface.
That surface has two pressure points, both already named above. The first is the OT/IT boundary itself: the DMZ, the conduits, and the firewall rules that decide what may cross. A flat network or an over-broad rule here lets a compromise of an ordinary office laptop reach a PLC that was never designed to authenticate its commands — the exact brownfield weakness the architectural-debt discussion described. The second is the edge-to-cloud path: every edge gateway, message broker, and cloud endpoint that carries curated data upward is also a door, and a poisoned reading injected at the edge or a tampered record altered in transit corrupts the analytical store and every model trained on it. This is why the IEC 62443 zones-and-conduits model [4] and NIST SP 800-82 [3] treat segmentation, authentication, and monitoring not as add-ons but as the load-bearing structure — and why the NOA second channel insists the optimization path flow one way only: a read-only diode cannot become an injection route.
The point for data management is that security and data integrity are the same discipline viewed from two sides. ALCOA+'s Original and Accurate attributes are meaningless if a record can be silently altered after the fact, so the access controls, audit trails, and network boundaries that security engineers build are precisely the mechanisms that make a record trustworthy. An architecture that gets the layering right but leaves the conduits open has not protected its data shadow; it has merely made it easier to falsify. The companion volume works one concrete slice of this in operating, scaling, and securing the platform, and the regulatory expectations land in data governance.
Validating the architecture: every level is a qualified system
Drawing the levels is design; in a GMP plant each system on the map must also be proven to do what it claims before a batch may rely on it. That proof is CSV — Computerized System Validation (documented evidence that a system is fit for its intended use), and it lands on every box in the level table: a Level 1 PLC, a Level 2 DCS, a Level 3 historian and MES, and the edge-to-cloud conduit between them are each a regulated computerized system, validated to the depth its risk demands. The conventional ladder is IQ/OQ/PQ — Installation Qualification (the system is installed and configured as specified), Operational Qualification (it functions across its operating range), and Performance Qualification (it performs reliably under real production conditions) — the staged evidence a historian or MES carries into an inspection. The amount of that evidence scales with risk: the modern CSA — Computer Software Assurance shift (the FDA-encouraged move from test everything identically and document it heavily to think about what matters and prove that well) tells a team to spend its assurance effort on the systems that could actually hurt a patient — the MES disposition logic, the conduit that carries release data — and to leverage supplier testing for the commodity layers, rather than screenshotting every click on a label printer. The full CSV-to-CSA philosophy, the GAMP 5 software categories, and the requirements-traceability matrix an inspector reads are the subject of validating computerized systems.
This is also where the ALCOA+ attributes become concrete obligations on the architecture rather than a checklist on a wall. The OT/IT conduit and its edge gateway must preserve Attributable (who or what produced the reading) and Contemporaneous (the timestamp captured at the moment of measurement, not when the record reached the cloud) as the value crosses the boundary; the contextualization layer must keep the reading Original and Accurate (the raw band carried through unchanged, never silently re-rounded); and — as the storage tier showed — the lakehouse realizes Enduring and Available. EU Annex 11 and 21 CFR Part 11 are the laws that turn these from good practice into a duty: Annex 11 requires the computerised system to be validated and to protect data integrity across exactly this OT/IT span, and Part 11 sets the matching electronic-record, electronic-signature, and audit-trail requirements — the regulatory surface the layered architecture must satisfy, treated in full in records, signatures, and the law.
Why it matters
For data management, architecture is destiny. The whole bioprocessing sequence — every physical step from seed train to fill-finish — generates the data shadow of Part I: the full record every batch casts as it is made. This architecture is what determines whether that shadow stays connected or scatters into silos. The level a system sits on determines what data it can reach, what it must hand off, and where the silos form. A historian at Level 3 can only enrich a tag if Level 1 actually published the context. An analytics model in the cloud is only as good as the contextualized stream the UNS feeds it. Seen through the FAIR lens — data that is Findable, Accessible, Interoperable, and Reusable — the layered map is what makes the first three possible: a tag is findable only once it has a meaningful UNS address, accessible only once a conduit is allowed to carry it across the OT/IT boundary, and interoperable only once OPC UA's self-describing model travels with it. Get the layering right and the data shadow flows as a connected, FAIR thread; get it wrong and you spend the project's life writing brittle one-off connectors between systems that were never meant to meet. This is also where regulation lands: in GMP manufacturing, EU Annex 11 governs computerised systems, explicitly requiring that the architecture preserve data integrity and be validated as fit for purpose across this OT/IT span [8]. A long-awaited revised draft of Annex 11, published for public consultation in July 2025, sharpens exactly the concerns of this chapter: it expands coverage to audit-trail review, cloud and SaaS service providers, data integrity across networked multi-system environments and AI/ML, and it formalizes the ALCOA+ attributes by name — codifying the Enduring and Available expectations the analytical-storage tier above must meet [9]. In the U.S., 21 CFR Part 11 imposes parallel requirements for electronic records, electronic signatures, and system validation across the same boundary [10]. Both laws are the subject of their own chapter, Records, Signatures, and the Law; here the point is only that the layered architecture is the surface these rules act on.
In the real world
Walk into a modern biomanufacturing facility and you can read the ISA-95 levels off the equipment: PLCs and a DCS in the control room (Levels 1-2), an MES and historian in the server room (Level 3), an ERP in the corporate cloud (Level 4). Real-time lab-data integration efforts target precisely the seams in this stack: making a LIMS result at Level 3 land, with its full context intact, where an enterprise model at Level 4 or an operator at Level 2 can act on it. Vendors increasingly ship Unified Namespace and MQTT/Sparkplug tooling out of the box [6], and the OT/IT convergence surveyed in the recent literature is moving from aspiration to default plant design [5]. The reference architectures are not academic: they are the shared language that lets a sensor vendor, a SCADA vendor, and an ERP vendor build systems that actually connect.
Key terms
- Reference architecture — an agreed map of a system's layers and how they connect.
- Purdue model — the foundational layered model of an industrial enterprise, basis for ISA-95.
- ISA-95 (IEC 62264) — the standard defining Levels 0-4 and how control systems link to business systems.
- ISA-88 (IEC 61512) — the batch-control standard separating recipe from equipment in a physical hierarchy.
- Levels 0-4 — physical process and field instruments, basic control, supervisory control, operations, and enterprise.
- PLC — Programmable Logic Controller; the basic/regulatory controller at Level 1 that reads instruments and drives actuators.
- SCADA / DCS — supervisory control and HMI software at Level 2; a DCS typically spans Levels 1-2.
- ERP — Enterprise Resource Planning; the business system at Level 4.
- OT / IT — Operational Technology (runs equipment) vs. Information Technology (runs data and business).
- CIA triad — confidentiality, integrity, availability; IT typically emphasizes confidentiality first, OT availability first, with safety an added concern outside the triad.
- DMZ — a buffer network between OT and IT that limits direct exposure.
- Zones and conduits — the IEC 62443 segmentation model grouping equipment and controlling traffic.
- Tag — a raw sensor name-and-value, meaningless without context.
- Contextualization — adding the surrounding meaning that turns a tag into information.
- UNS (Unified Namespace) — a single real-time map where all plant data lives at meaningful addresses.
- OPC UA (IEC 62541) — the typed, self-describing connectivity protocol spanning Levels 1-3; OPC UA PubSub adds a native publish-subscribe transport (over MQTT or UDP), and OPC UA FX (Field eXchange, over TSN) extends the model down into controller-to-controller communication.
- MQTT / Sparkplug — the lightweight publish-subscribe protocol and its industrial structuring spec; in Sparkplug B,
seqis a rolling per-message counter (NBIRTH = 0) andbdSeqis the birth/death sequence that pairs a session with its NDEATH. - Data fabric / data mesh / data lake — a unified technical access layer over scattered sources; a decentralized pattern where each domain owns its data as a product under federated governance; and a large store for raw and processed data.
- Time-series database / lakehouse — a tag-and-time-indexed store for hot operational data; versus columnar Parquet under Delta Lake or Apache Iceberg for long-retention, cross-batch analytics.
- NOA (NAMUR Open Architecture) — a reference model adding a read-only second channel for monitoring and optimization alongside the validated core automation pyramid.
- Edge / cloud computing — processing next to the equipment vs. in remote elastic data centers.
- PAT — Process Analytical Technology; the framework from Chapter 4 for designing, analyzing, and controlling manufacturing through timely measurement (not the instruments themselves).
- Contextualized row — a single record carrying a raw reading plus its batch, equipment, and phase context; the data-level product the architecture exists to produce (materialized in open-source as
s88.v_batch_sensor). - Architectural debt — the lasting cost of a plant whose security zones and OT/IT segmentation were retrofitted after the fact rather than designed in, leaving incomplete or bypassed boundaries.
- Security level — under IEC 62443, the graded protection target assigned to a zone; a zone is only as strong as its weakest member.
- Attack surface — every boundary and path an attacker could cross to reach plant systems; in a GMP plant the OT/IT boundary and the edge-to-cloud path are also data-integrity surfaces, because an intruder can alter records, not just read them.
- ALCOA+ Enduring / Available — two data-integrity attributes physically realized by the long-retention analytical tier: records must survive the full retention period (Enduring) and stay retrievable throughout it (Available).
- Protein A capture — the downstream affinity-chromatography step that pulls the antibody out of clarified harvest; its UV/conductivity/pH instruments, skid PLC, and SCADA map onto Levels 0-2 exactly as an upstream bioreactor's do, and its low-pH viral-inactivation hold is recorded as a Level 3 phase.
- RDF / triple / Turtle / SPARQL / SHACL — the graph data model whose atom is a subject-predicate-object triple; Turtle is its text syntax; SPARQL is its query language; SHACL is the shapes language that validates required facts are present (the graph counterpart of a
NOT NULLconstraint). - QUDT — the Quantities, Units, Dimensions and Types vocabulary; lets a value carry its unit as a machine-readable IRI so a number can never travel bare.
- Competency question — a plain-language question a data model must be able to answer, used as a pass/fail acceptance test (e.g. "what was the feed flow during the Production phase of B-2207?").
- Data leakage / grouped cross-validation — putting readings from the same batch into both training and test sets inflates a model's apparent accuracy; grouped (leave-one-batch-out) cross-validation holds each batch out together, possible only because
batch_idrode up the stack with the value. - Covariate shift / concept drift / applicability domain — the input distribution moving vs. the input-to-answer relationship changing; the applicability domain is the input region where a model was calibrated and can be trusted. Process drift (the living system changing) is a manufacturing event; model drift (the model going stale) is a data event.
- CSV / CSA / IQ-OQ-PQ — Computerized System Validation (documented evidence a system is fit for intended use); Computer Software Assurance (the FDA-encouraged shift to risk-based critical thinking over rote scripting); and Installation/Operational/Performance Qualification, the staged evidence each system carries into an inspection.
Where this leads
We now have the floor plan and the elevators — but an elevator only helps if everyone agrees how to load it. In Connectivity and Interoperability Standards we survey the languages that actually move biomanufacturing data with structure and meaning: OPC UA, MTP, SiLA 2, AnIML and Allotrope, and B2MML/ISA-95 messaging. There we draw the distinction that animates the rest of the book — the difference between moving bytes and preserving meaning — the question whose deep dive waits in Part IV.