Viral Safety: Learning Log-Reduction and Orthogonal Clearance
📍 Where we are: Part IV · Downstream, Learned — Chapter 14. The last chapter concentrated the antibody into the low-pH capture pool
PApool-001, far purer than the harvest (the raw cell-laden liquid drawn from the bioreactor) but not yet safe. Capture removed host-cell impurities; it did not remove viruses. This chapter is about the one downstream attribute where the bar for what a model may claim is highest in the entire book: the validated margin by which the process proves it can clear an adventitious virus.
Every batch of a mammalian-cell biologic carries an unavoidable risk: the CHO (Chinese hamster ovary) cells that make the antibody can themselves harbour endogenous retrovirus-like particles — a virus risk built into the cell line itself — and the raw materials and operators that touch the process can in principle introduce an adventitious virus, one accidentally brought in from outside. Regulators do not accept "we never saw one" as safety. They require proof — designed, deliberate viral-clearance studies in which a known virus is spiked into process intermediates and the manufacturer measures how many logs of it each step removes or inactivates. The sum of those logs, across steps that work by different mechanisms, is the safety margin the product is licensed on. It is a number with a hard floor, and it is the reason a biologic can be injected into a person.
Machine learning has a real, useful, and tightly bounded role here. It can predict a step's log-reduction value from process parameters, helping a developer design a robust filter or anticipate a weak run. It can model the orthogonality of a step train, making explicit which logs are genuinely independent. It can flag a viral-filtration run whose pressure-and-flux signature is drifting before the integrity test does. What it cannot do — and what this chapter is unusually firm about — is set the clearance claim. That claim is the conservative, lower-bound result of a validated GLP study, and a learned prediction is decision-support around it, never a substitute for it.
Imagine you must prove a water filter removes a contaminant. You do not just run clean water and declare it safe. You deliberately add a known amount of the contaminant, measure how much comes out, and report the worst-case reduction. To be sure one trick of the filter is not your only defence, you use two filters that work in completely different ways — one catches things by size, the other destroys them with acid — so a contaminant that slips past one is caught by the other. The trick is that the acid net only destroys the soft-shelled contaminants, while the size net is the only thing that stops the tiny, hard-shelled ones — so every threat is covered by at least one net, even though no single net covers them all. That is why you need both. That is orthogonal clearance: independent safety nets that add up. A machine-learning model here is the experienced engineer who can guess how well a filter will do before you test it, and who notices when a filter is fouling early — but the number you put on the label is still the measured, conservative worst case, not the engineer's guess.
What this chapter covers
We frame viral clearance as it actually works — validated spike studies, conservative LRV reporting, and the orthogonality requirement — then place learning precisely where it helps and nowhere it does not. We build three things on the running example: an LRV regression that predicts the small-virus log-reduction value of a parvovirus nanofilter from feed and process parameters (grounded in the campaign's real aggregate levels); an orthogonal-clearance model that sums per-step logs correctly, crediting only mechanistically distinct steps; and an unsupervised filtration anomaly detector that flags a fouling-driven pressure/flux signature. The runnable artifact is examples/platform/ml/viral_lrv.py. Throughout, one line is held: the model predicts and monitors; the claim is the validated, conservative number, and the decision to release is human and procedural.
Viral clearance, as the regulator sees it
The governing document is ICH Q5A(R2) — Viral Safety Evaluation of Biotechnology Products Derived from Cell Lines of Human or Animal Origin — finalized in its revised form in 2023 to extend the original guideline to new modalities and modern analytics [1]. Its logic rests on three pillars: select and test cell lines and raw materials so the risk of virus is low; test the unprocessed bulk to detect virus if present; and — the pillar this chapter lives in — demonstrate the capacity of the process to clear virus, so that even an undetected contaminant would be removed by a validated margin [1].
Clearance is measured in log-reduction value (LRV), the base-10 logarithm of the ratio of virus going into a step to virus coming out. Formally, the LRV of a step is the base-10 log of the total virus load in (input volume times input titre — the titre being the measured amount of virus per unit volume, here read as infectious units) divided by the total virus load out (output volume times output titre). The volume terms matter: a step that dilutes is credited for the total virus load it removes, not just the concentration change. An LRV of 4 means the step removed 99.99 percent; an LRV of 6 means 99.9999 percent. The value comes from a spike study: a high titer of a model virus is added to a scaled-down version of the process intermediate, the step is run, and the virus is titered before and after. The before/after titre is read by an infectivity assay (TCID50 or plaque — both grow the surviving virus on living cells and count how many can still infect, so they measure live virus); qPCR — a DNA-amplification technique that counts copies of the virus's genetic material (its genome), whether or not those particles can still infect — is a supplementary readout and is deliberately not relied on alone for inactivation steps, where a low-pH hold can destroy infectivity while leaving genomes detectable, so the genome count would understate the true reduction.
The reporting is deliberately conservative, and the arithmetic of that conservatism is the first reason a model cannot own the claim. Because the input spike is finite and the output is often below the assay's limit of detection (the smallest amount the assay can reliably see), the output titre is not measured but bounded — the study can only assert "no infectious virus in the volume assayed." Since all you know is that the output is less than that detection floor, you can only conclude the reduction is at least a certain size, never that it equals an exact value: this is what makes it a one-sided statement, a floor rather than a point. The reported LRV is therefore capped at the point of complete clearance and reported as a lower confidence limit of the measured reduction — a value the true reduction is, with stated confidence, at least as large as — not its point estimate. The PDA's technical practice (PDA Technical Report 47 on spike preparation, and the statistical treatment of clearance studies in Li and Yang's Biologicals analysis) formalizes reporting the lower 95 percent confidence bound of the reduction factor — the value that, allowing for the scatter and limited sensitivity of the assay, the true reduction is at least as large as 95 times out of 100 — as the conservative clearance estimate [1][2]. A model's job, if it has one, is to predict the expected LRV; the claim is structurally less than that, by an amount set by the assay sensitivity and the spike titre — quantities the model never sees.
The viruses tested are chosen to bracket the real risk. For a CHO process they include a model retrovirus (the endogenous risk, often a murine leukemia virus surrogate, large and enveloped) and a small, non-enveloped, notoriously robust parvovirus (minute virus of mice, MVM, the worst case for size-based and chemical clearance) [1]. The two were chosen precisely because they span the failure space: MVM is roughly 18 to 26 nm and chemically near-indestructible — non-enveloped, meaning it has only a bare hard protein shell with no outer lipid coat for acid to attack — so it stresses size and chemical clearance; the retrovirus surrogate is roughly 80 to 110 nm and enveloped, wrapped in an outer lipid membrane that a low-pH hold can disrupt, so it is the easy case for sieving but the meaningful test of inactivation. The small, hardy parvovirus is the one that drives the design of the dedicated virus-retentive nanofilter, and it is the target of the LRV model we build below — because it is the hardest to clear and therefore the one where a robust prediction is most valuable.
The regulatory frame — validated spike studies, conservative lower-bound LRV, orthogonality across mechanisms — is peer-reviewed-independent / regulatory and not in dispute: it is ICH Q5A(R2) (2023) [1] and the PDA/industry technical practice built around it (PDA TR 47; Li and Yang) [2]. The ML applications in this chapter are, by contrast, almost all (research): feed-property and process-parameter models for virus-filtration performance and fouling are peer-reviewed but small-scale and not deployed as release tools [3][4][5]. No regulator credits a predicted LRV; the claim is the validated number. Any framing of ML as "validating viral safety" would be wrong, and this chapter does not make it.
Orthogonality: why the logs are allowed to add
The single most important idea in viral clearance is orthogonality, and it is also the one a naive model gets wrong. A modern mAb process clears virus at several points: low-pH inactivation (holding the acidic Protein A eluate at pH around 3.5 for a fixed time inactivates enveloped viruses by disrupting their envelope), the Protein A capture and anion-exchange (AEX) polishing chromatography steps (chromatography flows the fluid through a packed column whose surface chemistry grabs some molecules harder than others, so the virus and the product travel at different speeds and separate — here the product is collected while the virus is partitioned away; "polishing" is a late, fine-cleanup column), and the dedicated virus-retentive nanofiltration step (which removes virus by size, sieving out particles larger than the membrane's rated pore). The total clearance is the sum of the per-step LRVs in log space — but only to the extent the steps are mechanistically independent [1][2].
The reason the logs add is that LRV is a logarithm of a multiplicative survival fraction. Each step lets through a surviving fraction equal to ten raised to the power of negative its LRV (an LRV of 4 lets through one ten-thousandth). For steps acting on the same virus, the fraction surviving the whole train is the product of the per-step surviving fractions, and because the logarithm of a product is the sum of the logarithms (log of a times b equals log a plus log b), the negative base-10 log of that product is the sum of the negative logs — so the total LRV is the sum of the per-step LRVs. That product rule is only valid when the steps' survival fractions are independent for the population of virus particles. When two steps remove virus by the same physical mechanism, the particles that survive the first step are exactly the ones predisposed to survive the second — the survival events are positively correlated, the product overstates clearance, and the sum overstates the log. That qualifier is everything.
Two chromatography steps that both partition by anion exchange are not fully orthogonal — a virus that resists one may resist the other for the same chemical reason, so their logs cannot simply be added at face value. Regulators therefore credit a clearance train by its distinct mechanisms: an enveloped virus inactivated by low pH and a non-enveloped virus sieved out by a nanofilter are orthogonal because no single failure mode defeats both. Note that low-pH inactivation gets essentially no credit against the non-enveloped parvovirus — it has no envelope to disrupt — which is exactly why MVM's clearance margin must rest on the size-based nanofilter: the two model viruses are cleared by different steps, the textbook case of orthogonality, and the reason a robust process never lets one mechanism carry both targets. A robust process is built to clear each target virus by at least two orthogonal mechanisms, so that the overall margin does not rest on one step working. Modeling this correctly means a clearance model must not be a blind sum; it must respect which steps share a mechanism — exactly the distinction our orthogonal_clearance() function below makes explicit by collapsing logs to the best value per mechanism before summing. (Our helper keeps the single best LRV per mechanism, the most conservative dedup; a fuller treatment would credit partial independence, but "best-per-mechanism" never over-claims, which is the property that matters here.)
This is why viral safety is the cleanest illustration of the book's recurring theme that physics and regulation, not data, set the ceiling on what a model may decide. The orthogonality rule is not a statistical artefact a model could learn around; it is a safety principle. A model that predicted a higher combined LRV by treating two same-mechanism steps as independent would be technically fitting the data and substantively dangerous.
Where learning genuinely helps: predicting an LRV
The useful ML task is forward prediction: given the feed quality and the process parameters of a clearance step, what LRV will it deliver? This matters in development, where a few costly spike studies must be placed wisely, and in manufacturing, where a model can anticipate whether a particular run's conditions are heading toward a weaker clearance than the validated worst case assumed.
For the parvovirus nanofilter — the size-based step, hardest to clear and most sensitive to feed quality — the relevant drivers are physical and well understood. The mechanism is sieving: the membrane's pore-size distribution sits just above the 18-to-26 nm parvovirus, so retention is exquisitely sensitive to anything that changes the effective pore structure during a run. Retention is not pure surface sieving, though, but size exclusion combined with depth and multi-layer capture (and, in some membranes, electrostatic interactions), which is why a pressure interruption or flux excursion (flux is the volume of liquid passing through the membrane per unit area per unit time — the same starting flow-per-filter-area introduced in harvest and clarification; a flux excursion is a sudden departure from its expected trajectory) can transiently release captured virus — the documented restart effect. That mechanism is the missing why behind the anomaly detector: a low-pressure or disrupted run signature is a genuine clearance risk, not just a process oddity. The dominant such thing is membrane fouling: as protein and aggregate deposit on and in the membrane, flux decays and a cake or pore-constriction layer forms. Counter-intuitively this often raises near-term retention (a tighter cake sieves harder) but it can mask, and eventually precede, a retention loss if the fouling drives pressure excursions or membrane defects. The standard engineering descriptor of this fouling is the Vmax / flux-decay model (Vmax here is the filter's maximum throughput — the total volume one square metre of membrane can process before it fouls shut, not a velocity) — the falling permeate flux trajectory across processed volume — which is why the fractional flux decay over a run is the single most informative process signal. The literature confirms this shape: virus-filtration performance can be predicted from feed biophysical properties and process conditions (Tang and coworkers built a 96-well Viresolve Pro scale-down screen that generates flux-decay curves across multiple mAb feeds and predicts filter performance from feed quality and process conditions), and fouling/flux trajectories carry the retention signal [3][4][5].
Feature engineering: six physical drivers
The model uses six features, each chosen because the membrane physics says it moves retention, not because it correlated in some table:
- Feed aggregate (high-molecular-weight, HMW) level — aggregates are the fastest-fouling species and the ones nearest the pore size; high HMW load is the classic precursor to premature fouling and is the strongest lever on retention.
- Transmembrane pressure (TMP) — the pressure difference across the membrane that pushes liquid through, i.e. the driving force; too low and the run cannot sustain flux through a fouling layer, too high and it risks compressing the cake or stressing the membrane.
- Fractional flux decay — the direct, integrated fouling signature over the run (the Vmax slope made dimensionless).
- Throughput (litres per square metre processed) — how hard the membrane was pushed; retention margin erodes as a membrane is loaded past its validated capacity.
- Protein concentration — the bulk fouling driver; higher load protein deposits faster.
- Membrane area margin — how generously the filter was sized relative to the validated load; a larger margin keeps each square metre below its fouling threshold and protects retention.
We ground the dominant feature in real data. The feed aggregate level is the campaign's actual SEC HMW release value — the high-molecular-weight (aggregate) percentage measured by a size-exclusion chromatography (SEC) assay and recorded as part of the batch's official release results, the "release value" that helps decide whether the batch may ship. For the golden batch (BATCH-2026-001, the chapter's running reference batch), SEC_HMW_pct = 1.287, with the six-batch campaign spanning 1.086 to 1.719 percent in examples/datasets/hplc_results.csv. The model centres its feed-aggregate feature on that real spread (hmw ~ Normal(mean, std + 0.25) reads "draw each value from a normal/bell-curve distribution with that mean and standard deviation"; the extra 0.25 widens the spread slightly so the synthetic feed covers a little more range than the six real batches, and the result is clipped to a physical 0.4 to 4.0 percent), so the predictor that matters most is anchored to the running example rather than invented. The LRV labels themselves are illustrative — real LRVs come from a handful of GLP spike studies that no public dataset contains — but the generative relationship encodes the genuine phenomenology: a high small-virus retention baseline (5.6) eroded by aggregate load, flux decay, throughput and protein, helped by area margin, capped at the conservative LRV_CAP = 6.0, with spike-titre measurement noise added. The model has to recover those signs and that shape from data; if it instead latched onto, say, transmembrane pressure as the dominant driver, that would be the tell of a spurious fit.
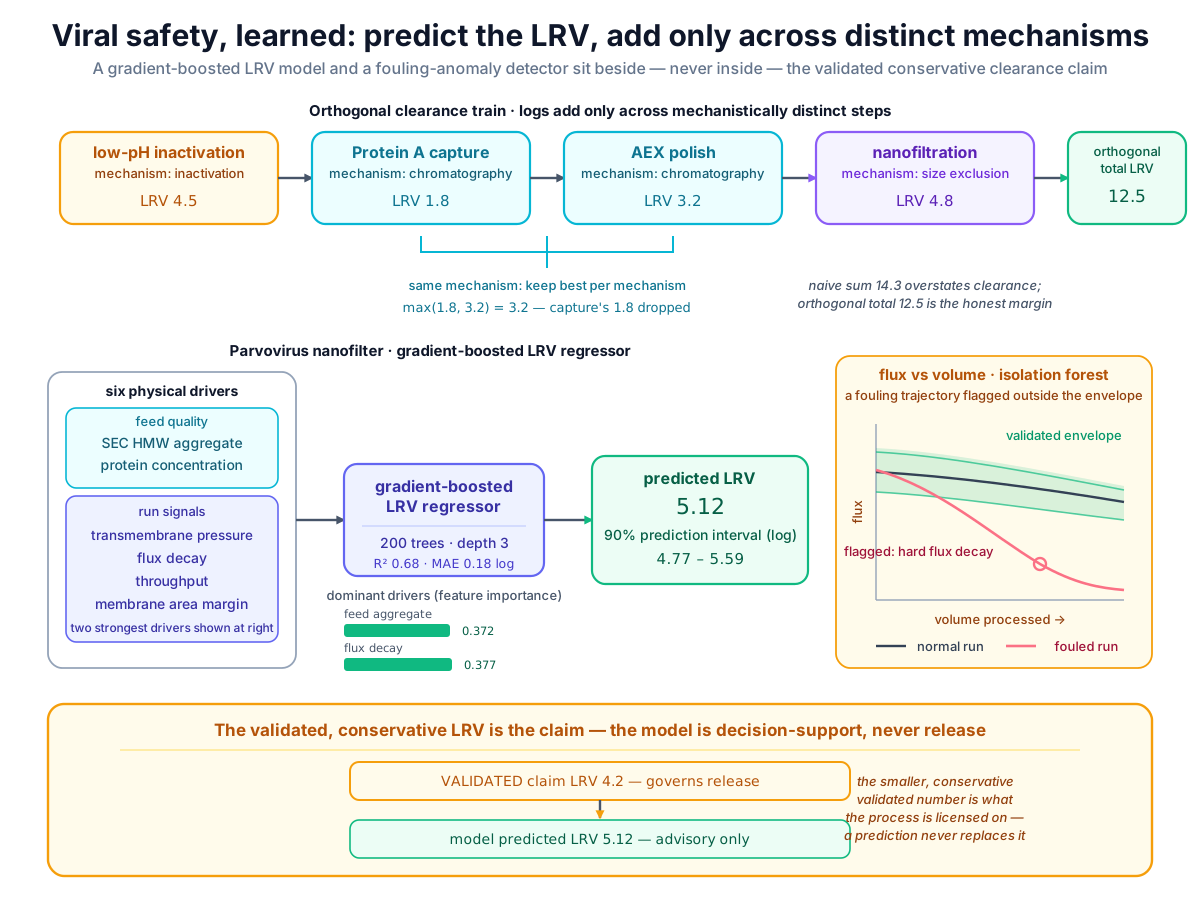 Viral safety, learned: orthogonal logs add only across distinct mechanisms (the two chromatography steps collapse to one before summing), a gradient-boosted model predicts the parvovirus nanofilter's LRV from feed aggregate and fouling signals, and an anomaly detector flags a drifting flux trajectory — all sitting beside, never inside, the validated clearance claim.
Original diagram by the authors, created with AI assistance.
Viral safety, learned: orthogonal logs add only across distinct mechanisms (the two chromatography steps collapse to one before summing), a gradient-boosted model predicts the parvovirus nanofilter's LRV from feed aggregate and fouling signals, and an anomaly detector flags a drifting flux trajectory — all sitting beside, never inside, the validated clearance claim.
Original diagram by the authors, created with AI assistance.
Building it: LRV regression, orthogonality, and anomaly detection
The module frames the three tasks on one consistent run history. The regressor is a gradient-boosted tree over the six physical features. Gradient boosting fits an additive ensemble (a team of models whose outputs add together) of shallow decision trees — a tree being a flowchart of yes/no splits on the feature values that ends in a predicted number. It starts from a constant prediction and, at each round, fits a new small tree to the residuals of the current ensemble — a residual being how far the current prediction still misses, here the actual value minus the predicted one (under a squared-error loss, where error is scored as the square of that miss, this residual is exactly the negative gradient, the direction that most reduces the error) — and adds that tree scaled by a small learning rate of 0.05, which trades more trees (200 of them, each depth 3) for lower variance. Trees are the right inductive bias here because the LRV response is non-linear and has interactions (high aggregate hurts more when the area margin is thin), and trees capture interactions without hand-specified cross-terms. The model is validated on a held-out 30 percent slice (train_test_split(test_size=0.3)), and it reports an honest R-squared (a 0-to-1 score for how much of the variation in the true LRVs the model explains — 1 is perfect, 0 is no better than always guessing the average) and a mean-absolute-error (MAE) in log units — the average size of the prediction's miss, ignoring its direction. Because in viral safety an error is naturally measured in logs of virus, the same units as the claim, an MAE of 0.18 log means the typical prediction is off by less than a fifth of a log, a quantity a reviewer can reason about directly. It also reports a genuine per-prediction 90 percent interval, not a bare point: two extra gradient-boosted fits under the pinball (quantile) loss — a loss that, instead of chasing the average, trains a model to predict a chosen percentile of the outcome — bracket each prediction with a [q05, q95] band (q05 is the 5th-percentile prediction, a low edge only 5 percent of true values should fall below; q95 the 95th-percentile high edge, so the gap between them should hold the middle 90 percent). The module then checks the band's empirical coverage on the held-out runs — does the nominal 90 percent band actually catch about 90 percent of them? — the honest spread a noisy LRV deserves, rather than the false confidence of a single number.
Because each row of the run history is an independent run rather than a time-ordered sample inside one batch, the run is the i.i.d. unit — independent and identically distributed, meaning each run is its own unrelated draw from the same population, with no hidden family ties that would let the model "cheat" by memorizing one and recognizing its sibling. When that holds, a random held-out split (set aside a random fraction of runs, train on the rest, test only on the held-out ones) is the correct test. The stricter leave-one-batch-out discipline the soft sensor and drift chapters insist on — hold out a whole batch at a time — is needed only when samples are correlated within a group (many readings from one batch), which these independent runs are not.
The orthogonal-clearance helper takes a step train annotated with each step's mechanism and sums correctly. The anomaly detector is an isolation forest, which is unsupervised — it is never shown labelled "good" and "bad" runs, it just learns the shape of the normal data and flags whatever sits apart. Isolation forests work by building random trees that recursively split on random features at random thresholds; a point in a dense, typical cluster needs many splits to be cut off on its own, but an outlier sitting far from the crowd gets isolated in just a few — so anomalous points have a shorter path length, and the anomaly score is a normalized average path length and the contamination=0.08 parameter sets the score cutoff so roughly 8 percent of training runs land outside the validated envelope. We train on the historical run signatures and use it to flag a deliberately fouled run.
# examples/platform/ml/viral_lrv.py — LRV regression + orthogonality + anomaly.
import numpy as np, pandas as pd
from sklearn.ensemble import GradientBoostingRegressor, IsolationForest
from sklearn.model_selection import train_test_split
from sklearn.metrics import r2_score, mean_absolute_error

FEATURES = ["feed_HMW_pct", "tmp_bar", "flux_decay_frac",
            "throughput_L_m2", "protein_g_L", "area_margin"]

def train_lrv(seed=2026):
    hist = _synthetic_lrv_history(seed=seed)        # feed-HMW anchored to real SEC HMW %
    X, y = hist[FEATURES].to_numpy(), hist["LRV"].to_numpy()
    Xtr, Xte, ytr, yte = train_test_split(X, y, test_size=0.3, random_state=seed)
    reg = GradientBoostingRegressor(n_estimators=200, max_depth=3,
                                    learning_rate=0.05, random_state=seed).fit(Xtr, ytr)
    pred = reg.predict(Xte)
    # honest per-prediction 90% band: two extra GBR fits under the pinball
    # (quantile) loss bracket each point with [q05, q95]; we report empirical
    # coverage on the held-out runs and a worked [lo, hi] for one example.
    lo = GradientBoostingRegressor(loss="quantile", alpha=0.05, n_estimators=200,
                                   max_depth=3, learning_rate=0.05,
                                   random_state=seed).fit(Xtr, ytr)
    hi = GradientBoostingRegressor(loss="quantile", alpha=0.95, n_estimators=200,
                                   max_depth=3, learning_rate=0.05,
                                   random_state=seed).fit(Xtr, ytr)
    lo_te, hi_te = np.minimum(lo.predict(Xte), pred), np.maximum(hi.predict(Xte), pred)
    coverage = float(((yte >= lo_te) & (yte <= hi_te)).mean())
    return {"r2": r2_score(yte, pred), "mae_lrv": mean_absolute_error(yte, pred),
            "pi_coverage_90": coverage, "pi_mean_width_lrv": float(np.mean(hi_te - lo_te)),
            "importances": dict(zip(FEATURES, reg.feature_importances_))}

def orthogonal_clearance(step_lrvs):
    """step_lrvs: name -> (mechanism, LRV). Sum naively, but credit only the best
    LRV per DISTINCT mechanism — the conservative, orthogonality-respecting total."""
    overall = sum(v for _, (_, v) in step_lrvs.items())
    best_per_mech = {}
    for _, (mech, v) in step_lrvs.items():
        best_per_mech[mech] = max(best_per_mech.get(mech, 0.0), v)
    return {"overall_LRV_naive_sum": round(overall, 2),
            "orthogonal_LRV": round(sum(best_per_mech.values()), 2),
            "mechanisms": best_per_mech}

def filtration_anomaly(seed=2026):
    hist = _synthetic_lrv_history(seed=seed)
    sig = hist[["tmp_bar", "flux_decay_frac", "throughput_L_m2"]].to_numpy()
    iso = IsolationForest(contamination=0.08, random_state=seed).fit(sig)
    fouled = np.array([[1.1, 0.55, 200.0]])          # low pressure, hard flux decay
    return {"injected_fouled_run_flagged": bool(iso.predict(fouled)[0] == -1)}
The orthogonality train the module evaluates is the running example's four steps, each tagged with its mechanism: low_pH_inactivation (inactivation, LRV 4.5), ProteinA_capture (chromatography, 1.8), AEX_polish (chromatography, 3.2), and nanofiltration (size_exclusion, 4.8). The two chromatography steps share a mechanism, so the best-per-mechanism dedup keeps only the AEX polish's 3.2 and drops the capture's 1.8 from the orthogonal total — which is exactly the conservative move regulators require. (These per-step LRVs are illustrative. In a real claim, robust reproducibility is required to credit a step at all — Protein A capture clearance is in fact often conservatively excluded because it is feed- and condition-dependent and not robustly reproducible, which makes the best-per-mechanism dedup even more cautious than the numbers shown here.)
Running python viral_lrv.py on the campaign data prints the verified output:
Real SEC aggregate (HMW) release % per batch (hplc_results.csv):
batch_id
BATCH-2026-001    1.287
BATCH-2026-002    1.247
BATCH-2026-003    1.086
BATCH-2026-004    1.280
BATCH-2026-005    1.169
BATCH-2026-006    1.719

LRV regressor (GBT, parvovirus nanofilter): R2=0.6839 MAE=0.1777 log10 (168 train / 72 test)
  90% prediction interval: empirical coverage=86% of held-out runs, mean width=0.98 log10; example run LRV 5.12 in [4.77, 5.59]
  drivers (feature importance): {'feed_HMW_pct': np.float64(0.372), 'tmp_bar': np.float64(0.039), 'flux_decay_frac': np.float64(0.377), 'throughput_L_m2': np.float64(0.042), 'protein_g_L': np.float64(0.047), 'area_margin': np.float64(0.123)}

Orthogonal clearance over 4 steps (3 distinct mechanisms):
  naive sum LRV = 14.3 log10
  orthogonal (best-per-mechanism) LRV = 12.5 log10
  by mechanism: {'inactivation': 4.5, 'chromatography': 3.2, 'size_exclusion': 4.8}

Filtration anomaly detector (IsolationForest): 20/240 historical runs flagged; injected fouled run flagged=True

ASSERT ok: LRV is predictable for decision-support, and a fouled filtration run is flagged -- but the CLAIM stays the validated, conservative LRV, not the model's prediction.
Read the output as a reviewer would. The regressor recovers the LRV with R-squared 0.68 and a mean absolute error of 0.18 log on the 72 held-out runs — deliberately not the suspicious 0.99 of the upstream soft sensor. Here a near-perfect score would be a red flag, not a triumph: LRV is genuinely noisy (the generative process injects spike-titre measurement noise and clips at the cap), so a model that fit it almost perfectly would most likely have memorized quirks of its training data or leaked information it should not have seen — and a model claiming near-perfect prediction of viral clearance would be the first thing a regulator distrusted. The 90 percent prediction interval is the honesty marker that matters most here: it covers 86 percent of the held-out runs at a mean width of 0.98 log — close to its nominal coverage and wide enough to be candid — and on the worked example it reports an LRV of 5.12 in [4.77, 5.59], a range a reviewer can size their trust against rather than a deceptively precise point. The two dominant drivers are flux decay (0.377) and feed aggregate (0.372), with area margin a distant third (0.123) and pressure, throughput and protein each near 0.04 — exactly the fouling story the physics predicts, and a reassuring sign the model learned the mechanism rather than a spurious correlation. (These are global impurity-based importances; they reliably surface that flux decay and feed aggregate dominate — the physics we expected — but impurity importance is known to favour high-variance continuous features and to under-credit binary ones, so a permutation-importance or SHAP check on a held-out fold would be the rigorous read before leaning on any single importance number too literally.) (The module's own assert m["r2"] > 0.5 encodes the floor: the model must be useful without being implausible.)
The orthogonality math is the chapter's whole point in three numbers: the naive sum of all four step logs is 14.3, but collapsing the two chromatography steps to their single best value per mechanism gives the conservative orthogonal total of 12.5 — the number a clearance argument should rest on.
And the anomaly detector flags 20 of 240 historical runs — about the 8 percent contamination budget set by contamination=0.08 — plus the injected fouled run, the prompt that would send an operator to an orthogonal integrity test — the post-use GMP check that proves the virus filter's membrane never developed a flaw and still delivers its rated clearance, a hard-stop that holds the batch if it fails, covered in full in Book 1's virus-filtration chapter. That 8 percent is an assumed budget, a knob that fixes how readily the detector cries foul, not a measured out-of-envelope rate the data revealed (the detector is fit and scored in-sample, so the knob forces roughly that fraction of the same runs to be flagged); a deployed version would anchor its cutoff to the validated pressure/flux limits or a clean reference period rather than to a fixed contamination fraction.
The validation angle: why this model never touches release
A model that influences a viral-clearance decision is, under the FDA's risk-based model-credibility framing, in the highest model-risk, highest decision-consequence category there is [6]. The credibility evidence it would have to carry is heavier than anything else in this book, and is worth naming concretely: a defined context-of-use that explicitly excludes setting the claim; a frozen training dataset with a recorded hash; a locked model with no online adaptation; a documented held-out validation with the metrics above; and a demonstration that the model's errors are bounded and non-conservative in the safe direction. Even with all of that, the model serves the validated study — it places spike studies, sizes filters, and raises fouling alarms — it does not replace it. The regulatory reasoning behind that hard line, on both the FDA and the EU sides, is set out in full in The unsolved part below; the point here is narrower and structural — this model is built to be decision-support, and its record is built to make that impossible to forget.
Anatomy of one LRV prediction record
A predicted LRV is small — one number with an interval — but it must travel inside a record that makes its non-bindingness explicit, or it will be misread as a claim. The record below is what the module produces for the golden batch's nanofiltration step, and every field is either a real input, a learned prediction with its honesty markers, or the validated number that actually governs release.
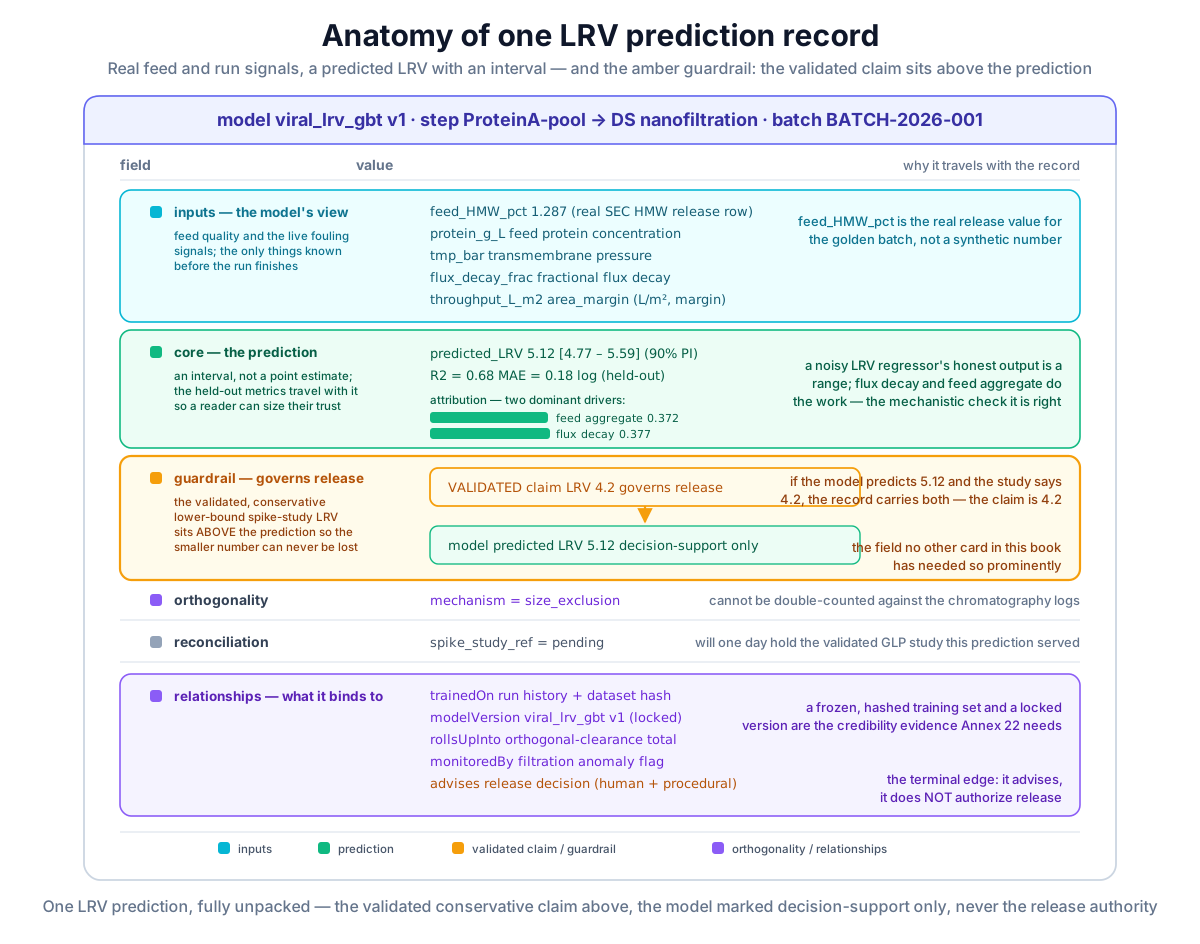 One LRV prediction, fully unpacked: real feed aggregate and run signals feed a model that predicts an LRV with an interval and names its drivers, but the field that matters most is the amber guardrail — the validated conservative claim sits above the prediction, and the model is marked decision-support only, contributing to an orthogonal total it is never allowed to set.
Original diagram by the authors, created with AI assistance.
One LRV prediction, fully unpacked: real feed aggregate and run signals feed a model that predicts an LRV with an interval and names its drivers, but the field that matters most is the amber guardrail — the validated conservative claim sits above the prediction, and the model is marked decision-support only, contributing to an orthogonal total it is never allowed to set.
Original diagram by the authors, created with AI assistance.
Read top to bottom, the card encodes the chapter's discipline as structure, field by field.
- Header.
model: viral_lrv_gbt v1,step: ProteinA-pool → DS nanofiltration,batch: BATCH-2026-001. The version is explicit because, under the draft EU GMP Annex 22, only a locked version is creditable; a silent retrain would invalidate every record it touched [7]. - Inputs. The only things known before the run finishes.
feed_HMW_pct = 1.287is the realSEC_HMW_pctrelease row for the golden batch, not a synthetic value; alongside it sit the protein concentration and the live fouling signals —tmp_bar,flux_decay_frac,throughput_L_m2,area_margin. These six are the model's entire view of the world. - Green core — the prediction. A predicted LRV with a real 90 percent prediction interval (the quantile-loss
[q05, q95]band, e.g. 5.12 in [4.77, 5.59]), not a bare point estimate, because the honest output of a noisy regressor is a range; the model's held-outR2 = 0.68andMAE = 0.18 logtravel with the number so a reader can size their trust; and a feature-attribution mini-bar shows flux decay and feed aggregate doing the work — though a per-record attribution properly wants a per-prediction SHAP value rather than this global importance, the mechanistic check that the prediction is for the right reason. - Amber guardrail — the field no other anatomy card in this book has needed so prominently. The validated, conservative claim — the lower-bound spike-study LRV — sits above the prediction and is flagged as the only number that governs release. If the model says 4.8 and the validated study says 4.2, the record carries both and the claim is 4.2. The guardrail exists so the smaller number can never be lost behind the larger, more flattering one.
- Orthogonality row. Records that this step's log counts toward the process total only as a distinct (size-exclusion) mechanism — so the record itself knows it cannot be double-counted against the chromatography logs.
- Reconciliation row. A placeholder for the eventual spike-study reference, the field that will one day hold the GLP result this prediction was decision-support toward.
- Relationships panel. Binds the record to its training run history and dataset hash, to the model version, to the orthogonal roll-up and the anomaly flag, and — the terminal edge — to a release decision it advises but does not authorize.
The prediction is useful precisely because the record makes its limits impossible to forget.
The record as a graph: why the guardrail survives a column rename
The relationships panel is not a drawing convention — it is the same typed-edge discipline Book 4 makes executable, and viral safety is the place it earns its keep most sharply, because here the field that must never be lost is the smaller number. Written as RDF (the subject-predicate-object triple data model) with OWL (the logic layer that lets a relation carry rules), the card's edges become literal triples an inspector can query rather than read off a slide:
# the LRV prediction record as triples — the guardrail is a typed edge, not a UI element
bp:LRVpred-DS-001-nf  a              bp:LRVPrediction ;
                      bp:forStep     bp:NF-001 ;             # nanofiltration of the ProteinA pool
                      bp:advises     bp:ReleaseDecision-DS-001 ;   # advises, never authorizes
                      bp:predictedLRV "5.12"^^xsd:float ;
                      bp:claimLRV    bp:SpikeStudy-MVM-001 ; # the VALIDATED number governs release
                      prov:wasGeneratedBy bp:viral_lrv_gbt_v1 ;
                      prov:used      bp:TrainSet-2026Q2 .     # PROV-O lineage to the frozen dataset
Three things follow from typing the record this way, and each lifts the record above a flat row in a registry table:
- A feature pulled by its IRI, not a fragile column name. The dominant input — the feed-aggregate feature — is not "the column named
feed_HMW_pct"; it is the value the drug-substance lot carries on the semantically identified, unit-bearing predicatebp:hmwPct, a1.287typedxsd:floatand tagged with the UCUM unit code for percent so the number can never be silently read as a fraction. The sameSEC_HMW_pctrelease row the model consumes is, in Book 4, a datatype property on the lot —bp:DS-001 bp:hmwPct 1.287— so a model wired to the IRI survives the instrument swap, site transfer, and column rename that would break a pipeline keyed ondf["feed_HMW_pct"]. That cross-system identity is the semantic-interoperability work the data book does: the feature's lineage anchors it to an ISA-95-style equipment and batch hierarchy, the live filtration pressure/flux signals arrive over OPC UA (the standard industrial-data transport), and the batch record they are grounded against is a B2MML document (the XML serialization of the ISA-95 / ISA-88 batch model) — so the six features are not a private CSV convention but rows pinned to the same standards the historian, MES, and LIMS already speak. - The claim and the prediction are different kinds of thing, and the graph knows it. Book 4's upper-ontology continuant/occurrent cut keeps a measured LRV value (a continuant — a quality that persists on the lot) distinct from the spike study and the filtration run (occurrents — processes that unfold in time) that produced it. That is not philosophy: it is the type discipline that stops the pipeline from ever collapsing the model's
bp:predictedLRVinto the study'sbp:claimLRV. The amber guardrail, modeled, is two different predicates on two different kinds of entity — which is precisely why no rename or join can quietly let the flattering prediction stand in for the validated floor. - The grouping key is a lineage edge. Were these runs correlated within a batch, the leave-one-batch-out split the soft sensor insists on would be
bp:derivedFromread as a grouping key — every run sharing a production ancestor held out together — rather than a brittlebatch_idstring match. The runs here are i.i.d., so a random split is correct; but the mechanism that would enforce honest grouping if they were not is the transitive lineage spine, not a column.
The deeper payoff is trust by construction. The same closed-world SHACL release gate (Shapes Constraint Language — a shape that fails now when a required result is missing, where OWL would only shrug "unknown") that decides whether a lot may ship is, read from the model's side, a guarantee that a training row's inputs and label are complete, singular, and in range before the model is allowed to learn from them. A bp:ReleaseShape whose sh:minCount 1 fires when the SEC HMW result silently never loaded is the same shape that should reject a training row whose feed-aggregate feature never arrived — so the readiness gate and the release gate are one artifact. And a one-line SPARQL competency question — which nanofiltration steps carry a predicted LRV but no validated spike-study claim yet? — is exactly the audit the reconciliation row exists to answer, run as a pass/fail check rather than a manual hunt. A model whose features are semantically grounded, whose inputs are SHACL-validated, and whose record is a queryable subgraph is FAIR (Findable, Accessible, Interoperable, Reusable) and trustworthy by construction — which is the deeper reason the validated graph, not the model's fluency, is the ground truth a GraphRAG assistant is grounded against: ask such a model "was this lot's viral clearance proven?" and the honest answer is one the graph derives and certifies (its SHACL-checked release shape and its bp:claimLRV edge to a real spike study) while the model merely generates.
The unsolved part: a model that is structurally not allowed to be the answer
The honest open problem in viral-safety ML is not accuracy. It is that the most consequential number — the clearance claim — is, by regulation and by physics, forbidden to be a model output, and that constraint is unlikely to relax. Viral safety is the place where the FDA's model-credibility framework bites hardest: a model influencing a viral-clearance decision is the highest model-risk, highest decision-consequence category there is, demanding the heaviest credibility evidence — and even then it serves the validated study, it does not replace it [6]. Draft Annex 22 reinforces this from the other side: it requires locked models under a predetermined change-control plan and excludes adaptive AI from critical GMP functions, and few functions are more critical than proving a medicine cannot transmit a virus [7]. So the ceiling on viral-safety ML is not data or algorithm; it is that the field has — correctly — decided no model should carry this decision.
This creates a genuinely hard design tension the rest of the book mostly escapes. Everywhere else, a sufficiently good, well-validated model can become the decision (real-time release, autonomous pooling within a locked rule). Here it structurally cannot, so the model's entire value must be realized upstream of the decision: better filter design, smarter spike-study placement, earlier fouling alarms, and a clearer picture of where the orthogonal margin is thin.
A second, deeper difficulty compounds it: the labels are catastrophically scarce. A process may have only a handful of validated spike-study LRVs ever — they are expensive, GLP, and performed at scale-down — so the supervised model trains on almost no real ground truth. Our module sidesteps this with a synthetic run history, but a real deployment cannot: it would face perhaps five to fifteen labelled points spanning a narrow, validated process window, which is far too few to fit a six-feature gradient-boosted model with any honesty, and which would never contain the failure region (a fouled, low-retention run is, by design, something the validated process avoids). This is the classic small-sample, no-negative-examples regime, and it is why our R-squared sits at a sober 0.68 only because the synthetic history is large; the real-world version is worse.
The most defensible path forward is the book's recurring one: hybrid and Bayesian approaches that fold in the known physics of membrane sieving — the Vmax fouling law, the pore-size-distribution sieving model, the multilayer/blocking mechanisms reviewed in the Merck-group virus-filtration literature [4] — as a mechanistic prior, with a Gaussian-process or Bayesian-neural residual learning only the correction from the handful of real points, and with priors borrowed from related processes and platform knowledge. Such a model can return an LRV with a calibrated uncertainty that widens honestly outside the validated window, instead of a black box extrapolating confidently into a region it has never seen. But even a perfectly calibrated hybrid model still does not get to set the claim. Until validated clearance data is far cheaper — which it will not be soon, because the cost is intrinsic to the GLP spike study, not to the analytics — viral-safety ML is, and should remain, a powerful assistant to a study it is not permitted to become.
What this chapter adds to the model suite
This chapter contributes examples/platform/ml/viral_lrv.py to Book 5's example suite — the LRV-regression, orthogonal-clearance, and filtration-anomaly module. It provides:
train_lrv()— a gradient-boosted regressor predicting a parvovirus nanofilter's LRV from six physical features (feed aggregate, transmembrane pressure, flux decay, throughput, protein concentration, area margin), validated on a held-out slice (R-squared 0.68, MAE 0.18 log over 168 train / 72 test) and reporting feature importances that surface flux decay (0.377) and feed aggregate (0.372) as the dominant drivers.orthogonal_clearance()— the correct log-space roll-up that credits only the best LRV per distinct mechanism, returning both the naive sum (14.3) and the conservative orthogonal total (12.5) for the running example's four-step train, with the two chromatography steps collapsed to one mechanism.filtration_anomaly()— an unsupervised isolation-forest detector over the run's pressure/flux/throughput signature (20 of 240 historical runs flagged at an 8 percent contamination budget) that flags a deliberately fouled run as a prompt for an orthogonal integrity test.real_hmw_by_batch()— the loader that grounds the feed-aggregate feature in the campaign's realSEC_HMW_pctrelease values fromexamples/datasets/hplc_results.csv.
It deliberately complements the downstream modules either side of it — chromatography.py (capture) and resin_lifetime.py (polishing) — by adding the one place where the suite's standing rule (a model may, when good enough, become the decision) is itself overridden by a safety constraint, making viral_lrv.py the example that teaches the line as much as the technique.
Like every module in the suite, viral_lrv.py is built only on the permissively-licensed open-source stack — scikit-learn and NumPy/pandas (BSD / Apache-2.0), no vendor black box — so the gradient-boosted regressor, the quantile bands, and the isolation forest are all inspectable and re-runnable on a laptop. Reproducibility is not assumed but pinned: a single seed=2026 drives every train_test_split, every GradientBoostingRegressor fit, and the IsolationForest, so the verbatim output above (R-squared 0.6839, 20 of 240 runs flagged) re-prints byte-for-byte, and the run_all.py harness records the dataset hash that ties this LRV history to the same hplc_results.csv release rows the rest of the suite reads. A locked viral-safety model whose library versions floated would not actually be locked — the open stack only reproduces because the seed, the data, and the environment are all version-pinned, the unit of validation the open-source analytics chapter and the MLOps chapter treat as one.
Why it matters
Viral safety is the attribute a patient's life most directly depends on, and it is therefore the sharpest test of whether a manufacturer understands what ML is for. Get the framing right — model predicts, monitors, and designs; validated study claims; orthogonality respected; release human and procedural — and learning makes the process safer in the ways it legitimately can: a better-sized nanofilter, a spike study placed where the margin is thin, a fouling alarm that fires before the integrity test, an orthogonal-clearance roll-up that is honest about shared mechanisms. Get it wrong — let a predicted LRV stand in for a validated one, sum same-mechanism logs as if orthogonal, or let a model adapt a clearance-affecting rule online — and you have not just over-claimed; you have undermined the single guarantee that lets a biologic be injected into a human being. This chapter is the book's clearest statement that the highest form of ML maturity is sometimes knowing exactly where a model must stop.
In the real world
The deployed reality matches the cautious framing. Mechanistic and statistical understanding of virus filtration is mature and used in development, but the machine-learning layer is research, not routine. The named, correctly-attributed examples of the genre:
- Tang and coworkers (Journal of Membrane Science, 2020) — high-throughput virus-filtration screen (research). A 96-well Viresolve Pro scale-down model that generates flux-decay curves across multiple mAb feeds and predicts filter performance from feed quality and process conditions [3]. This is a process-development screening tool, not a release method, and is the most directly relevant validation of the chapter's feature choices — performance falls out of feed and run parameters. Evidence: peer-reviewed-self-authored (the screen was developed by the filter user's own group).
- The Merck/MilliporeSigma virus-filtration group (iScience review, 2025) — fouling and performance prediction (research). Led by a Merck virus-filtration scientist — the manufacturer of the Viresolve line — the review covers predicting virus-filtration performance from feed and material properties and the multilayer/blocking fouling mechanisms behind it [4]. It is the representative Merck-group example referenced throughout this chapter; because the lead author works for the filter vendor and cites prior in-house work, it is correctly read as vendor-adjacent / peer-reviewed-self-authored, not independent.
- Tuo and coworkers (Separation and Purification Technology, 2025) — 1D-CNN fouling prediction (research). A one-dimensional convolutional (deep-learning) model that predicts and interprets protein-fouling flux trajectories in membrane filtration, supporting the claim that the flux-decline signature carries a learnable retention/performance signal [5]. Evidence: peer-reviewed-independent, but on general membrane fouling, not a deployed virus-clearance release tool.
Across the industry, the ISPE Pharma 4.0 picture holds with extra force here: viral clearance shows up in pilots and design tools, essentially never in autonomous control, because the regulatory and physical ceiling is explicit. The validated-study-as-claim discipline is codified in ICH Q5A(R2) [1] and the PDA technical-report practice around it [2], and the model-risk thinking that would govern any ML support tool is the FDA's 2023 AI-in-drug-manufacturing discussion paper and its credibility framework [6]. Book 1's downstream chapters describe the physical clearance steps, Book 2 the soft-sensor and validation discipline these models inherit, and Book 4's downstream ontology the same step train modeled as a graph.
Key terms
- Viral clearance — the demonstrated capacity of a process to remove or inactivate virus, established by validated spike studies and measured as the sum of orthogonal per-step log reductions; one of the three pillars of viral safety under ICH Q5A(R2).
- Log-reduction value (LRV) — the base-10 log of the ratio of virus in to virus out of a step (accounting for volume), so an LRV of 4 is a 10,000-fold reduction. Reported as a conservative lower confidence bound, capped at complete clearance.
- Spike study — a scaled-down experiment in which a known model virus is added to a process intermediate and titered before and after the step to measure its LRV; the source of the validated claim.
- Orthogonal clearance — clearance achieved by mechanistically distinct steps (e.g. low-pH inactivation, chromatographic partition, size-based nanofiltration), so that no single failure mode defeats the margin; logs add only across distinct mechanisms because only then are the per-step survival fractions independent.
- Virus-retentive nanofiltration — a size-exclusion step that sieves out virus particles larger than the membrane's rated pore; the dedicated clearance step for the small, robust parvovirus, and the one most sensitive to fouling.
- Low-pH inactivation — holding the acidic Protein A eluate at low pH for a fixed time to inactivate enveloped viruses; an orthogonal inactivation mechanism distinct from removal.
- Parvovirus (MVM) / retrovirus — the small, non-enveloped worst-case virus driving nanofilter design, and the large enveloped endogenous-risk virus; the two model viruses that bracket CHO-process clearance.
- Membrane fouling / flux decay (Vmax) — protein and aggregate deposition on a filter that lowers flux and can erode virus retention; the dominant predictor of nanofilter LRV and the signal the anomaly detector watches.
- Decision-support (vs release) — the bounded role ML plays in viral safety: it predicts, monitors, and helps design, but the clearance claim is the validated conservative number and the release decision is human and procedural.
- Typed edge / IRI / PROV-O — modeling the prediction record as RDF triples whose predicates are IRIs (web-style global names) drawn from the ontology, with PROV-O lineage edges (
prov:used,prov:wasGeneratedBy) binding the prediction to its frozen dataset and model version, so a feature survives a column rename and the validated claim can never be confused with the prediction. - SHACL as a training-data gate / FAIR — the same closed-world release shape that gates a lot's CQA panel also certifies a training row is complete, singular, and in range; a model whose features are IRI-grounded, whose rows are SHACL-validated, and whose record is a queryable subgraph is Findable, Accessible, Interoperable, and Reusable (FAIR) by construction.
- ISA-95 / B2MML / OPC UA / UCUM — the interoperability standards the feature row is pinned to: the ISA-95 equipment/batch hierarchy, the B2MML batch-record serialization, the OPC UA transport that carries the live pressure/flux signals, and the UCUM unit code that travels with each value — so the six features speak the same language the historian, MES, and LIMS already do.
Where this leads
The product is now concentrated, captured, and proven to clear virus by a validated orthogonal margin — but it still carries low levels of charge variants and aggregates that the next column must trim. The next chapter, Polishing Chromatography: Trajectory Models and Resin Lifetime, returns to the chromatography toolkit at finer resolution — modeling the charge-variant trajectory of a cation- or anion-exchange polishing step, and the slow degradation of an expensive resin across its validated cycle life — where a pooling rule again trades a quality attribute against yield, and a learned model again advises a governed repack it is not allowed to perform on its own.