The Open-Source Historian: Choosing and Running a Time-Series Store
📍 Where we are: Part III · Storing & Connecting — Chapter 16. The capture layer is now pushing a river of sensor readings at us; this chapter builds the place those readings live — an open-source historian — and is honest about where open source stops and a commercial PI server begins.
A process historian is a tireless clerk whose only job is to write down every number the plant emits, forever, with the time it happened — and to hand any slice of it back to you in milliseconds. A bioreactor — a large, tightly controlled tank in which living cells grow and secrete the drug — breathes out a reading every few seconds: temperature, pH, dissolved oxygen, titer (the concentration of antibody product in the broth). Over a 14-day batch that is millions of slips of paper. An ordinary database chokes on that; a historian is built for it. The commercial gold standard is AVEVA PI (formerly OSIsoft PI). In this book we build the open-source equivalent — and we tell you plainly the two places it is not equivalent: the patented compression PI is famous for, and PI's native quality flag on every value — both explained in full later in this chapter.
What this chapter covers
In the capture chapters (5–12) we wired sensors, edge gateways, and collectors that all funnel readings toward one table. This chapter is where that table actually lives. We will:
- build the historian as a TimescaleDB hypertable inside PostgreSQL, so high-rate sensor data and the relational batch model — the ordinary SQL tables that describe which batch, phase, and equipment a reading belongs to (Chapter 4) — share one engine;
- pre-roll one-minute and one-hour summaries with continuous aggregates, and bound storage with a retention policy — being honest that these conveniences are TimescaleDB Community (TSL) features, free to run but source-available (you can read the code but not freely reuse and redistribute it) rather than open source under the OSI (Open Source Initiative) definition;
- name the license trap out loud (the genuinely Apache-2.0 core — Apache-2.0 being a permissive, OSI-approved open-source licence that lets anyone use, modify, and redistribute the code — is just hypertables,
create_hypertable,time_bucket, anddrop_chunks; continuous aggregates, retention/CAGG policies, and the Hypercore compression all sit under the source-available TSL) and survey the strictly Apache-2.0 alternatives — three other open-source time-series databases, Apache IoTDB, InfluxDB 3 Core, and QuestDB; - explain swinging-door compression — the algorithm every commercial historian uses — and why a careless deadband can silently corrupt the record;
- and confront the one thing no open-source historian ships out of the box: PI's per-value data-quality flag, and how this repo carries it anyway.
The schema in this chapter lives in examples/platform/db/20-historian.sql and is applied automatically on first container init by make up (the db/ directory is mounted into Postgres's /docker-entrypoint-initdb.d, so the 00–60 schema files run when the database first starts); the data flowing into it is produced by the deterministic simulator in examples/sim/bioproc_sim/fed_batch.py, then generated and loaded by make data and make load. Both are real and tested.
One table to hold everything
The heart of the historian is almost insultingly simple. Here is the whole table, from examples/platform/db/20-historian.sql:
CREATE TABLE ts.sensor_reading (
    ts       timestamptz      NOT NULL,
    tag      text             NOT NULL,
    value    double precision,
    unit     text,
    quality  smallint         NOT NULL DEFAULT 192,  -- legacy OPC DA: 192 Good, 64 Uncertain, 0 Bad
    batch_id text
);
Six columns. A timestamp, a tag name, a number, its unit, a quality code, and the batch it belongs to. This long, narrow shape — one row per reading rather than one column per sensor — is the defining choice of a historian. A new sensor is a new value of tag, not a schema migration; a thousand tags and one tag cost the same to model. It is the relational mirror of the OPC UA address space we read from in Chapter 7 — OPC UA being the industrial communication standard whose server exposes every sensor as a named, browsable node.
The next line is what turns an ordinary Postgres table into a time-series engine:
SELECT create_hypertable('ts.sensor_reading', 'ts', chunk_time_interval => INTERVAL '1 day');
CREATE INDEX ON ts.sensor_reading (tag, ts DESC);
CREATE INDEX ON ts.sensor_reading (batch_id, ts DESC);
A hypertable looks and behaves exactly like one table — you INSERT and SELECT against ts.sensor_reading as normal — but underneath, TimescaleDB automatically slices it into chunks partitioned by time, here one chunk per day [1]. That partitioning is why a query for "yesterday's titer" never scans last month: the planner touches only the chunks whose time range overlaps your query. The two indexes mirror the two questions the rest of the book asks — give me one tag over time and give me one batch over time — both kept in descending time order because the most-asked question is "what happened recently?".
Why a Postgres extension and not a purpose-built time-series server? Because the bioprocess world is fundamentally a join problem — a join being the database operation that stitches rows from two tables together on a shared key (here, the batch_id). A temperature reading is meaningless until it is tied to its batch, its phase, its equipment, and its recipe — all of which live in the relational ISA-88/95 model we built in Chapter 4 (ISA-88 and ISA-95 are the manufacturing standards that describe batches, recipes, and equipment as structured data). Keeping the historian inside the same PostgreSQL instance means that join is a plain SQL join, no cross-system glue, which is exactly what Chapter 17 exploits. We trade some raw ingest throughput (how fast rows can be written in) for the ability to ask process questions in one query — the cost is real because a full relational engine maintains transactional guarantees and general-purpose indexes on every write, where a purpose-built time-series server can take shortcuts a generic database will not. For a single monoclonal-antibody (mAb) line that is the right trade.
Anatomy of a historian reading: the long-narrow atom
The whole platform rests on this six-column row, so it is worth dissecting one field at a time — because each column is a deliberate decision, and getting any of them wrong propagates upward through every chapter that joins to this table. Take a single real row from the committed golden dataset (examples/datasets/fedbatch_timeseries_10min.csv): 2026-01-05 00:00:00+00, BR101.DO.PV, 40.8224, %sat, 192, BATCH-2026-001. Read it field by field and the design intent becomes visible.
ts(timestamptz NOT NULL) — the source timestamp in UTC, and the column TimescaleDB partitions on. It is not a write time; it is the contemporaneous moment the probe was read, which is what makes the record contemporaneous in the ALCOA+ sense (ALCOA+ is the FDA/EMA data-integrity expectation — checked by inspectors during GMP audits, so failing it can trigger a regulatory finding such as a 483 or warning letter — that records be Attributable, Legible, Contemporaneous, Original, and Accurate, plus Complete, Consistent, Enduring, and Available). It is also the chunk key: the value2026-01-05 00:00:00+00decides which one-day chunk this row lands in.tag(text NOT NULL) — the long-narrow dimension. This is the column that lets a thousand sensors share one table: a new sensor is a new value oftag, never a new column. Its dotted structure (BR101.DO.PV= asset · measurement · role — here bioreactor BR101, its dissolved-oxygen probeDO, reporting the present process valuePV— what the probe actually measures — rather than a setpointSP, the target value the controller is aiming for) is decoded in the card below.value(double precision) — exactly one float, and the seam this chapter keeps returning to. One scalar per row is the right home for a temperature, a pH, a titer number. It is the wrong home for a 701-point spectrum or a chromatogram (both are multi-point curves — hundreds of numbers that mean something only taken together — not single readings), which is why the next subsection is titled the way it is. (Note it is the one column not markedNOT NULL: a probe can be online but momentarily produce no value, and a NULL value with aqualityof Bad is a more honest record than a fabricated zero.)unit(text) — the denormalized unit string (%satfor percent of oxygen saturation,degC,g/L) — denormalized meaning deliberately stored redundantly on every row rather than looked up from a separate table.40.8224alone is meaningless;40.8224 %satis a fact. Denormalizing the unit onto each reading is a small storage cost that removes a join from every query and a whole class of unit-confusion errors from every dashboard.quality(smallint NOT NULL DEFAULT 192) — the legacy OPC DA trust flag (192 Good, 64 Uncertain, 0 Bad),NOT NULLwith a default of Good so a reading is never stored without a trustworthiness verdict. This is the column commercial PI has and most OSS forgets, developed in its own section below.batch_id(text) — the relational join key. It is what turns "37.04 °C at some instant" into "37.04 °C during BATCH-2026-001", by pointing at the ISA-88 batch record (s88.batch) that Chapter 17 joins to. A NULLbatch_idis legitimate — a reading taken between batches still belongs in the historian.

Anatomy of one historian reading: six columns, with the single double precision value highlighted as the scalar-only seam — one float per row fits a temperature or a titer, but not a spectrum.
Original diagram by the authors, created with AI assistance.
This six-column row is the open-source landing place for a data-point born two books earlier. In Book 1, the physical step is the production bioreactor — the breathing CHO (Chinese Hamster Ovary) cell culture whose probes emit a temperature, a pH, a dissolved-oxygen, a titer every few seconds. In Book 2, Where Process Data Is Born frames that reading as a value with provenance, and Automation and Control Data poses the open challenge — the historian's deadband and compression — that this chapter's SQL answers. The tag, value, unit, quality, ts, batch_id you see above are that abstract reading made concrete in a row.
The data that lands here
The numbers in this table are not hand-typed; they come from the deterministic simulator in examples/sim/bioproc_sim/fed_batch.py, which models a 14-day fed-batch CHO culture — Monod-kinetics growth limited by glucose and glutamine (a fed-batch is a culture topped up with nutrient feeds rather than run as one fixed charge), a death phase as nutrients deplete, lactate produced then consumed, and antibody titer accumulating with the integral of viable cells, all under PID-style controllers with bounded sensor noise. It declares its sixteen tags explicitly:
def _tag_specs() -> dict[str, str]:
    return {
        "BR101.Temp.PV": "degC",
        "BR101.Temp.SP": "degC",
        "BR101.pH.PV": "pH",
        ...
        "BR101.OnlineGlucose.PV": "g/L",
        "BR101.Titer.PV": "g/L",
    }
The point worth dwelling on is determinism. The simulator seeds its randomness from one master value (SIM_SEED=2026) hashed with a per-stream label, so the same run produces byte-identical numbers on any machine — which is what lets the book quote exact values and CI verify them. Running it as a smoke test produces:
$ python -m bioproc_sim.fed_batch
BATCH-2026-001: rows=322560 tags=16
  final VCD=18.2e6  viab=64%  titer=5.77 g/L
That last line reports the culture's end state — VCD is viable cell density (here 18.2 × 10⁶ cells per millilitre, written 18.2e6 in scientific notation), viab is viability (the fraction of cells still alive), and titer the antibody concentration. That rows=322560 is sixteen tags times 20,160 minutes — a fortnight stored at one row per minute. The native acquisition is faster (a real skid emits every few seconds); 1/minute is the cadence the historian persists, a first, honest form of downsampling — deliberately keeping fewer readings than were acquired — that we will return to. A slice of the long-format stream, taken from examples/datasets/fedbatch_timeseries_10min.csv, is exactly what INSERTs into the table — note that this committed golden CSV is deliberately thinned to one row every 10 minutes (32,256 rows; a short first-two-hours excerpt is also committed as fedbatch_timeseries_10min.sample.csv) to keep the repo small, so its rows are a downsampled view of the simulator's native 1/minute, 322,560-row stream, not a different dataset:
ts,tag,value,unit,quality,batch_id
2026-01-05 00:00:00+00:00,BR101.Temp.PV,37.0145,degC,192,BATCH-2026-001
2026-01-05 00:00:00+00:00,BR101.DO.PV,40.8224,%sat,192,BATCH-2026-001
2026-01-05 00:00:00+00:00,BR101.pH.PV,7.0511,pH,192,BATCH-2026-001
2026-01-05 00:00:00+00:00,BR101.Titer.PV,-0.0045,g/L,192,BATCH-2026-001
(Yes, titer reads slightly negative at inoculation — that is measurement noise around a true value of zero, deliberately kept so the data behaves like a real probe, not a textbook.)
The quality flag: the column commercial historians have and most OSS forgets
Look again at that quality column, and at how the simulator fills it. The fed-batch model injects a deliberate fault on day 7 — a cooling excursion where the temperature setpoint dips half a degree and the dissolved-oxygen probe goes unreliable for three hours:
GOOD, UNCERTAIN, BAD = 192, 64, 0                 # legacy OPC DA quality codes
...
if excursion:
    # day-7 cooling excursion: setpoint dips 0.5 degC for ~3 h, DO reads uncertain
    e0 = int(7 * 24 * 60)
    e1 = e0 + 180
    temp_sp[e0:e1] = 36.5
    temp[e0:e1] = 36.5 + rng.normal(0, 0.05, e1 - e0)
    do_uncertain[e0:e1] = True
Those 192 / 64 / 0 numbers are legacy OPC DA (Classic) status severities — Good, Uncertain, Bad — carried from the source all the way into storage. They look arbitrary because they are an artefact of the original protocol: OPC DA packed quality into one byte where the top two bits encode the verdict, so Good lands at 192 (binary 11000000), Uncertain at 64 (01000000), and Bad at 0 — and the whole industry simply kept speaking those exact numbers. (As Chapter 7 established, these are the OPC DA packed-quality bytes; OPC UA-native quality is instead a 32-bit StatusCode where Good is 0, so we keep the well-known 192/64/0 codes the simulator and most historians still speak.) During the excursion the temperature and DO readings are written with quality = 64, and you can see them in the stored data:
ts,tag,value,unit,quality,batch_id
2026-01-12 00:00:00+00:00,BR101.Temp.PV,36.593,degC,64,BATCH-2026-001
2026-01-12 00:10:00+00:00,BR101.Temp.PV,36.4887,degC,64,BATCH-2026-001
2026-01-12 00:20:00+00:00,BR101.Temp.PV,36.468,degC,64,BATCH-2026-001
This matters more than it looks. A value of 36.47 °C that is Good and a value of 36.47 °C that is Uncertain are different facts about the world, and conflating them is a data-integrity failure — the "A" for Accurate in ALCOA+ depends on a reading carrying its own trustworthiness. Commercial PI has carried a quality/substituted-data flag on every point for decades. Here is the honest open-source reality: none of the open historians ships PI's native quality model — not TimescaleDB, not IoTDB, not InfluxDB, not QuestDB. So this repo does the obvious thing PI does for you: it makes quality a first-class, NOT NULL column with an explicit default of 192 (Good) and lets the collector down-rate it. That is a small piece of design discipline, not a feature you download — and it is the kind of gap this book exists to name.
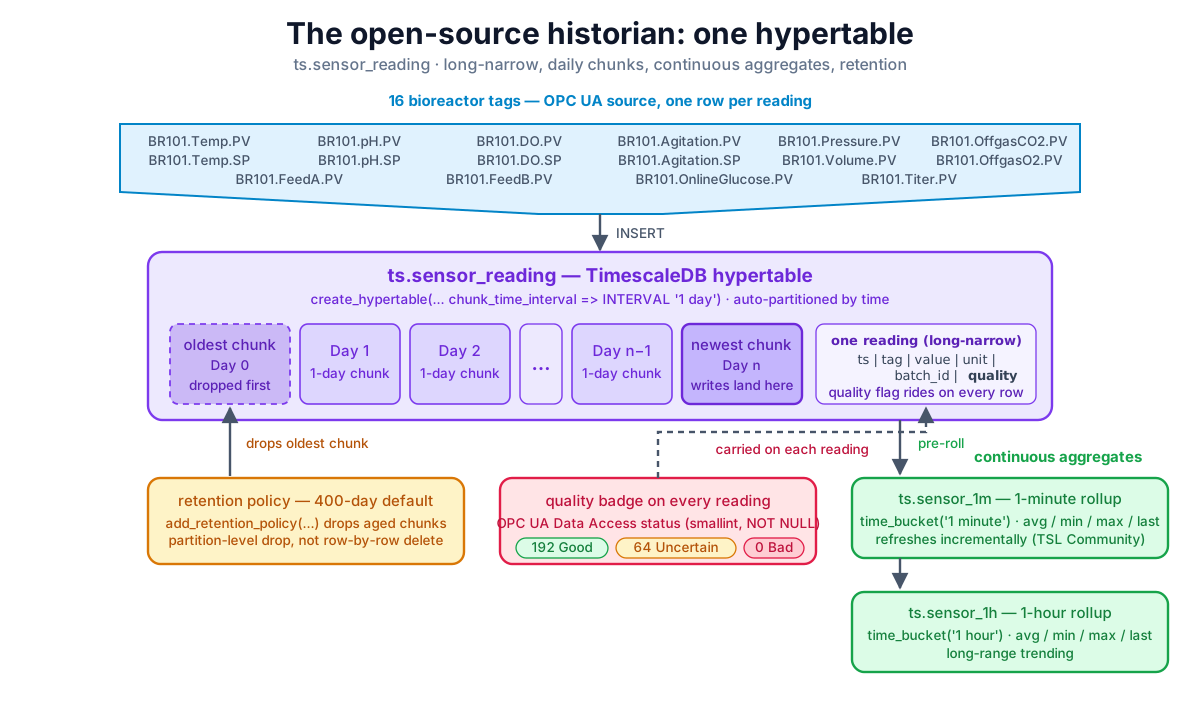
The open-source historian: one long-narrow hypertable auto-partitioned into daily chunks, fed by sixteen tags, pre-rolled into 1-minute and 1-hour continuous aggregates, bounded by a retention policy, with the legacy OPC DA quality flag carried on every row. Original diagram by the authors, created with AI assistance.
Why scalar-only: a spectrum is not a tag
There is a shape this schema is honest about not fitting, and it is worth naming before the next chapter leans on the table. Every row of ts.sensor_reading holds exactly one double precision — one float per timestamp per tag. That is the right home for a scalar signal: a temperature, a pH, a single titer number. But not every measurement is a scalar. A Raman or NIR spectrum is a vector — in this book's own analytics chapter it is 701 intensity points across wavenumber (a measure of light energy: each point is the signal strength at one colour of light) — and a chromatogram is a curve, a whole trace of detector response over elution time. The N-GLYcanyzer testbed (an in-line analyser — one plumbed directly into the bioreactor loop so it measures the broth automatically, without a human pulling a sample — introduced in that analytics chapter) makes this concrete: its HILIC-HPLC run — a liquid-chromatography separation of the antibody's glycans (the sugar chains attached to it), where the instrument sorts a mixture into its components and a detector traces how much of each comes out over time — does not emit one glycan number, it emits a glycan chromatogram (that whole detector trace, hundreds of points) alongside a single Protein A titer (a quick affinity measurement of how much antibody is present). The titer is a scalar and lands in this hypertable as one row, exactly as designed. The chromatogram is not, and trying to force it in would be a category error.
Why not just write 701 rows, one float each, with the wavenumber smuggled into the tag (Raman.wn_400, Raman.wn_402, …)? Because that quietly throws away the one thing that makes the array an array — that those 701 numbers are a single observation taken together, indexed by a physical axis — and it bloats the long-narrow table with the very tag explosion the schema was meant to avoid. A point-per-row scalar tag is the wrong container for a vector payload. The right containers are a deliberate choice about which side of the fence you stand on. On the storage side: a Postgres array or JSONB column when you want the spectrum beside its relational context, or — far better at analytics scale — a column-oriented array store, which is exactly what the analytics chapter does when it parks each spectrum as one row of a 701-column Parquet file (Parquet being a compact file format that stores data column-by-column, which is fast to scan for analytics). On the standards side, the array is a first-class citizen by design: two vendor-neutral analytical-data formats, Allotrope ADF (a binary container built on the scientific HDF5 file format) and AnIML (an XML form), carry it — ADF in an n-dimensional Data Cube built for spectra, chromatograms, and curves, AnIML as a SeriesSet of arrays — the formats the analytical-lab chapter walks through alongside Allotrope ASM (those JSON and XML result forms hold a single scalar result; the dense array belongs in the binary ADF container). The lesson is the one the quality-flag section just made, in a different key: pick the container that fits the data's true shape, and do not let a tidy scalar table tempt you into flattening a curve into noise.
The same row as a triple: the tag is an implicit vocabulary
The dotted tag BR101.DO.PV and the quality byte do more work than a flat string suggests: they are an implicit ontology — a shared vocabulary the whole plant already half-agrees on — waiting to be made explicit. That decomposition (asset · measurement · role) is exactly the structure a formal model writes down as classes and relations, and it is worth seeing the bridge, because Chapter 19 lifts this very table into an RDF knowledge graph. The Resource Description Framework (RDF — the W3C model where every fact is a triple: subject, predicate, object) would render one stored reading not as a row but as a small bundle of triples — a value typed against the QUDT units ontology and tied back to the asset and the batch:
# Illustrative — the same reading as RDF triples (bridges to Chapter 19's graph).
bp:reading-0001 a sosa:Observation ;
    sosa:observedProperty bp:DissolvedOxygen ;   # the 'DO' measurement role
    sosa:madeBySensor     bp:BR101-DO-probe ;     # the 'BR101' asset
    sosa:hasResult [ qudt:numericValue 40.8224 ; qudt:unit unit:PERCENT ] ;
    sosa:resultTime "2026-01-05T00:00:00Z"^^xsd:dateTime ;
    bp:qualityCode 192 ;                           # 192 Good, the OPC DA flag
    bp:fromBatch  bp:BATCH-2026-001 .
Three things the relational table holds implicitly become first-class facts here. The unit string becomes a typed quantity through QUDT, the units-and-dimensions ontology Book 4 uses, so 40.8224 %sat carries its dimension as machine-readable data rather than a column that any dashboard can misread. The batch_id foreign key becomes a derivedFrom-walkable edge, the genealogy relation that lets one query trace a lot's whole lineage. And the dotted tag's three parts become an asset, a measurement property, and a role drawn from a shared class taxonomy (Book 4's classes-and-taxonomy) instead of a convention only the originating DCS understands.
The quality flag, in particular, is a natural competency question — the kind of question the specification phase says the model must be able to answer. "Return every released batch carrying a reading with quality other than Good during its Production phase" is a one-line SPARQL ASK/SELECT once the tag is a typed property, but a brittle string-parse against the flat table. And the closed-world guarantee the historian leans on — that a reading is never stored without a trustworthiness verdict (quality NOT NULL) — is precisely what a SHACL shape (the Shapes Constraint Language, RDF's closed-world validator) enforces in Book 4's release gate: sh:minCount 1 on the quality property is the graph-native form of the NOT NULL constraint. The historian is the home domain's pragmatic version of the same discipline; the ontology books make the vocabulary explicit so the value, its unit, its quality, and its lineage all mean the same thing in the LIMS, the MES, and the graph.
Pre-rolling the data: continuous aggregates
A dashboard does not want 20,160 raw points (one tag stored once a minute across the 20,160 minutes of a fortnight) to draw a 14-day trend on a 1,200-pixel screen — it wants a summary. Computing avg/min/max over the raw table on every refresh is wasteful when the answer barely changes. TimescaleDB's continuous aggregates solve this: they are materialized views over a hypertable — a materialized view being a stored, precomputed query result you can read like a table — that refresh incrementally as new data lands, so you never recompute history. From examples/platform/db/20-historian.sql:
-- 1-minute rollup (avg/min/max/last) as a continuous aggregate
CREATE MATERIALIZED VIEW ts.sensor_1m
WITH (timescaledb.continuous) AS
SELECT time_bucket('1 minute', ts) AS bucket,
       tag,
       avg(value)  AS avg_value,
       min(value)  AS min_value,
       max(value)  AS max_value,
       last(value, ts) AS last_value
FROM ts.sensor_reading
GROUP BY bucket, tag
WITH NO DATA;
time_bucket is the time-series analogue of GROUP BY: it rounds each timestamp down to its one-minute slot so every reading falls into a bucket. The last(value, ts) aggregate — picking the most recent value in each bucket, not just the average — is the one a process engineer reaches for constantly and that plain SQL makes awkward. A second view, ts.sensor_1h, rolls the same data up to hourly granularity for long-range trending. Crucially we keep min and max alongside avg: a one-minute average would have smoothed away a brief spike, but the max column preserves it. That is the difference between a summary you can trust for a deviation investigation and one that quietly hides the evidence.
Anatomy of a rollup: one continuous-aggregate bucket
If the raw reading is the historian's atom, the continuous-aggregate bucket is its molecule — and it pays to dissect one the same way. A row of ts.sensor_1h has six fields too, but they mean something different: instead of one reading, a bucket summarises many. Aggregating the first hourly window of BR101.DO.PV from the golden dataset (the six 10-minute readings spanning 2026-01-05 00:00 through 00:50, which all fall in the 00:00 one-hour bucket) produces one summary row whose fields read like this:
bucket(time_bucket) — the floor of the window.time_bucketisGROUP BYfor time: every reading in the window collapses to one slot, here2026-01-05 00:00:00+00.tag(text) — the dimension carried straight through theGROUP BY, unchanged. One bucket exists per(bucket, tag)pair, soBR101.DO.PVrolls up independently ofBR101.Temp.PV.avg_value(avg(value)) —39.6358. The smooth line a dashboard draws — and, on its own, a liar about extremes.min_value(min(value)) —38.0121. The low edge of the window.max_value(max(value)) —40.8224, highlighted in the card because it is the safety column: the momentary high thatavgwould have smoothed into invisibility survives here. A summary that kept onlyavgwould be the kind that "quietly hides the evidence"; keepingmax(andmin) is what makes the rollup trustworthy for a deviation investigation.last_value(last(value, ts)) —40.086. The most recent reading in the window, the value a "current state" panel wants — and the aggregate plain SQL makes awkward, which is exactly why TimescaleDB ships it.

Anatomy of one rollup bucket: many raw readings in, one ts.sensor_1h summary row out, with max_value highlighted as the column that preserves a spike the average would smooth away.
Original diagram by the authors, created with AI assistance.
The aggregates do not refresh themselves by magic; a policy schedules it:
SELECT add_continuous_aggregate_policy('ts.sensor_1m',
    start_offset => INTERVAL '3 days', end_offset => INTERVAL '1 minute',
    schedule_interval => INTERVAL '1 hour');
Read that as: every hour, refresh the one-minute rollups for data between three days ago and one minute ago — recent enough to be useful, far enough back that late-arriving readings have settled.
One honest caveat, developed fully in the license section below but flagged here so it is not a surprise: continuous aggregates (CREATE MATERIALIZED VIEW … WITH (timescaledb.continuous)) and the background-job scheduler that drives add_continuous_aggregate_policy are TimescaleDB Community (TSL) features, not Apache-2.0 ones. They are free to run, but they are source-available, not OSI open source — the same caveat that applies to Hypercore compression. If you must stay strictly Apache-2.0, the equivalent is a plain CREATE MATERIALIZED VIEW refreshed on an external cron schedule; you lose the incremental, never-recompute-history behaviour but keep a clean licence.
Retention: keeping the right amount, for the right time
A historian that never forgets eventually fills the disk. The opposite mistake — forgetting a record the law requires you to keep — is worse. TimescaleDB lets you express retention declaratively, dropping whole aged chunks rather than deleting rows one by one:
-- keep raw readings for 400 days (multi-jurisdiction retention is set per region
-- in Chapter 26; this is a safe default longer than any single chapter needs).
SELECT add_retention_policy('ts.sensor_reading', INTERVAL '400 days');
A word on what is and is not open source here, because it is exactly the kind of detail this book refuses to gloss over. The manual primitive — calling drop_chunks('ts.sensor_reading', older_than => INTERVAL '400 days') yourself, on your own schedule — is Apache-2.0. The declarative add_retention_policy above, which registers a background job so you never have to remember, is a TimescaleDB Community (TSL) feature [2], riding the same job scheduler as the continuous-aggregate policy. It is free to run but source-available, not OSI open source. A strictly Apache-2.0 stack would replace this one line with a cron job that calls drop_chunks directly. Either way the mechanism is the same: dropping a chunk is cheap because it is a partition-level operation; deleting 322,560 rows with a WHERE clause is not.
But the number 400 days is not arbitrary, and this is where regulation, not engineering, sets the dial. U.S. cGMP (current Good Manufacturing Practice, the FDA's regulatory framework for drug manufacturing) requires batch records be retained at least one year past the batch's expiration date, with retained electronic records or true copies kept readily retrievable [8]. The EU's Annex 11 (the EudraLex GMP guideline on computerised systems) goes further on the medium: stored and archived data must be secured and periodically checked for accessibility, readability, and integrity across the entire retention period — you cannot just keep the bytes, you must keep them readable [9]. So 400 days is a deliberately conservative single-instance default; the real, per-jurisdiction retention matrix is data the platform loads in Chapter 26, because a global manufacturer keeps the same data for different lengths of time depending on where it was made.
The license trap, said plainly
The Apache-2.0 vs TSL license seam
Here is the honesty this book promised, and it is sharper than the convenient story. TimescaleDB is dual-licensed, but the Apache-2.0 line falls in a less generous place than most write-ups admit. The genuinely Apache-2.0 core is small: hypertables and create_hypertable, the time_bucket function, the first/last aggregates, and manual chunk management via drop_chunks [1]. A large set of the convenient features lives in a tsl/ directory governed by the source-available Timescale License (TSL), which is not an open-source license under the OSI definition. Crucially, three things this chapter leans on are TSL, not Apache-2.0: continuous aggregates (the WITH (timescaledb.continuous) materialized views), declarative retention (add_retention_policy), and the background-job scheduler behind add_continuous_aggregate_policy. The headline TSL feature is the Hypercore columnstore and native compression — the very thing you would most want for a multi-year historian, and the thing PI does brilliantly — but the automation we used above is on the same side of the line. None of this costs money; the TSL is free-to-use and source-available. It simply is not OSI open source, and pretending otherwise is the exact licensing overstatement this book exists to avoid.
So this chapter takes the pragmatic honest-hybrid path: we run the TSL Community automation (continuous aggregates and add_retention_policy) because it is free and excellent, while staying off the one TSL feature — Hypercore compression — whose absence costs us only disk. The comment block at the top of examples/platform/db/20-historian.sql names that boundary exactly:
-- Apache-2.0 core (hypertables, create_hypertable, time_bucket, drop_chunks) plus
-- free TimescaleDB Community (TSL) automation: continuous aggregates and
-- add_retention_policy. TSL is free-to-use and source-available, but NOT OSI
-- open source. We deliberately do NOT use the TSL Hypercore columnstore/compression,
-- so a strictly Apache-2.0 build is one cron-driven drop_chunks away — see Chapter 16.
That is the trade-off in one paragraph. The companion stack pins the standard timescale/timescaledb:2.17.2-pg17 image, which bundles the free TSL Community features, so the continuous aggregates and add_retention_policy in this file run as written. If you must instead be strictly Apache-2.0 — for example to redistribute the stack without any source-available component — switch to the Apache-only -oss (open-source-software) build — a separately packaged, Apache-2.0-only distribution — which does not even expose the TSL functions, and replace the continuous aggregates with plain materialized views refreshed by cron and add_retention_policy with a scheduled drop_chunks. The historian is then under a true open-source licence, at the cost of that convenience. Conversely, if your organisation is comfortable with TSL terms, turning on Hypercore is a one-line change and a large storage win. Each of these is a licensing decision, and we make it visible rather than smuggling it in.
The strictly Apache-2.0 alternatives exist precisely for teams that will not accept source-available terms at all. Apache IoTDB is cleanly Apache-2.0 and device-native: it models each series as a (device, measurement, timestamp, value) path and ships its own columnar TsFile format, a natural fit when you think in terms of equipment trees rather than SQL tables [3]. InfluxDB 3 Core — the open-source tier, MIT/Apache-2.0, rebuilt on Apache Arrow, DataFusion, and Parquet — is permissive, though the Enterprise and Cloud tiers are not, which is why a careless influxdb:latest pull is a known trap [4]. QuestDB is Apache-2.0 with purpose-built SQL time-series operators like SAMPLE BY, LATEST ON, and ASOF JOIN that make time-aligned queries terse [5]. We ship TimescaleDB as the default because the join-to-the-batch-model story is so much cleaner inside one Postgres — and we are explicit that the default uses free TSL Community automation, while a reader who needs strictly Apache-2.0 everywhere has a real, named path.
Swinging-door compression: power and peril
The feature TSL gates — and the technique every commercial historian leans on — deserves its own explanation, because it is where "save space" can quietly become "change the record." The classic algorithm is swinging-door trending, patented by the industrial-controls firm Bristol in 1987 [6]. The intuition: instead of storing every point on a slowly changing signal, store a point only when the line can no longer be drawn through the readings within a tolerance band — a "deviation" or deadband, which is simply how far a reading is allowed to wander before a new point is recorded. A flat temperature trace holding at 37.0 °C for an hour collapses from 3,600 points to a handful, reconstructed by linear interpolation — simply drawing a straight line between the stored points to fill in the gaps.
That tolerance parameter is a knife that cuts both ways. It is the single dial that governs the trade-off between storage reduction and reconstruction error [7]. Set it loose and you get spectacular compression — and you can smooth away the very excursion you are obligated to detect.
When the deadband erases the excursion
The danger here is not theoretical, and it is worth grounding in evidence and in this book's own data. Studies of swinging-door on high-rate sensor streams quantify the failure precisely: an over-aggressive tolerance introduces real reconstruction error that distorts the recorded signal, and that error grows with the deadband [10]. The algorithm has done exactly this since Bristol patented it in 1987 — it is designed to drop points the line can be drawn through, and a wide enough band draws the line straight through a real event [6]. Now apply that to our own record. The simulator's day-7 cooling excursion drives BR101.Temp.PV from a 37.0 °C setpoint down to roughly 36.5 °C — a peak deviation of only about 0.5 °C — and the stored rows during the window carry the readings 36.593, 36.4887, and 36.468 degC, each flagged quality = 64 (Uncertain). A swinging-door deadband set to a seemingly innocuous ±0.5 °C — a value an engineer might pick to "remove sensor noise" — would draw a straight line clean across that three-hour dip and store nothing: the excursion you are obligated to detect, and the Uncertain quality flags that prove the probe was struggling, both vanish into a single interpolated segment. For a GMP record that is not merely a quality concern; it is the Accurate in ALCOA+ at stake.
The lesson the chapter wants you to leave with: lossy compression is legitimate and ubiquitous, but the deadband is a validated parameter, not a storage-saving afterthought, and the safest open-source posture is to store the raw record and downsample with explainable rollups (our continuous aggregates) rather than reconstructing from a lossy original. The rollup keeps min and max precisely so a 0.5 °C dip survives the summary; the deadband, set carelessly, destroys it at the source.
The historian as the training substrate for a model
Everything downstream of this table that learns — the Raman soft sensor, the release predictor, the drift detectors of Book 5 — draws its fuel from exactly these columns, so three of the historian's design choices are silently also model-quality decisions. First, the batch_id is the unit a model must be split on, not the row. A naive random train/test split that scatters minutes from one batch into both halves leaks information across the seam and inflates the score: rows from the same fed-batch are autocorrelated, so a model can "predict" a held-out minute by memorising its neighbour. The honest split is grouped by batch_id — leave-one-batch-out cross-validation, where a whole campaign is held out at once — which is exactly the leak-free, batch-aware split Book 5 insists on. The historian makes that trivial: the group key is a first-class column, not something to reconstruct after the fact.
Second, the quality flag is an applicability-domain signal. A model is only trustworthy on inputs that resemble what it was calibrated on; the day-7 quality = 64 window is, in model terms, an out-of-domain region the training set should either exclude or learn to flag. Feeding Uncertain readings to a soft sensor as if they were Good is how a model gets confidently wrong — the same failure the applicability-domain and leakage discussion warns against — and the column that prevents it is the one most OSS historians forget to keep.
Third, the deadband is a drift trap an MLOps loop cannot see past. Book 5's drift detectors split process change into covariate shift (the inputs P(X) move — a fouling probe, a new media lot) versus concept drift (the input-to-output mapping P(Y|X) moves), and they run a label-free input monitor (the Population Stability Index) to catch the first early (the MLOps chapter). But a swinging-door deadband that has already smoothed an excursion out of the raw record has destroyed the very distributional evidence that monitor reads — the drift is invisible because the signal that proved it never reached storage. Storing the faithful raw record is therefore not only an ALCOA+ obligation; it is the precondition for any honest drift detection or model-lineage audit (which version of the model saw which retained chunk) downstream. Governed, faithful, batch-keyed data is the floor a trustworthy model stands on, and this table is where that floor is poured.

Why it matters
The historian is the floor the whole platform stands on. Get its shape wrong and every chapter above it inherits the mistake. Three decisions in this one short DDL file carry the most weight. The long-narrow schema means adding sensors never costs a migration. Keeping the historian inside PostgreSQL means contextualization (Chapter 17) is a join, not an integration project. And carrying the OPC DA quality flag as a first-class column means a reading's trustworthiness travels with it into the permanent record — which is the technical precondition for ALCOA+ data integrity and for any audit-trail review that follows. The pieces we deliberately left out — TSL compression, swinging-door lossy reduction — matter just as much, because choosing not to use them is what keeps the stack cleanly open and the recorded signal faithful.
In the real world
For thirty years the answer to "where do plant signals live?" has been OSIsoft PI, now AVEVA PI — a mature, validated, vendor-supported historian with native compression, a per-point quality model, and an asset framework, deployed in nearly every large biomanufacturer. An open-source historian gets you genuinely far: TimescaleDB or IoTDB will ingest your tags, roll them up, retain them, and serve them at no licence cost, and they do it well. The honest gaps are specific and worth stating without flinching. You do not get PI's patented compression for free (it is TSL-gated or absent). You do not get a built-in quality flag (you build the column, as we did). And you do not get a vendor's validated-system package, support contract, or supplier accountability that a GAMP-5 (Good Automated Manufacturing Practice, guide 5 — the standard for validating computerised systems; validating a computerised system means documented, regulator-required proof that the software does what it is supposed to and keeps records trustworthy) assessment leans on — that burden becomes yours, and Chapters 20 and 25 take it seriously, including a real bidirectional bridge to PI for the very common case where PI stays the system of record (the authoritative, official source for a piece of data) and the OSS stack is the analytics layer beside it. That hybrid is not a failure of open source; it is the realistic shape of a regulated plant.
Key terms
- Historian — a database specialized for storing and serving high-rate, timestamped process signals; the open-source analogue of AVEVA/OSIsoft PI.
- Titer — the concentration of antibody product in the broth, in grams per litre (g/L); the headline yield number, taught in Book 1's production-bioreactor chapter.
- ALCOA+ — the FDA/EMA data-integrity expectation that records be Attributable, Legible, Contemporaneous, Original, and Accurate, plus Complete, Consistent, Enduring, and Available.
- Hypertable — a TimescaleDB table that behaves like one table but is auto-partitioned into time-ranged chunks, so queries scan only the relevant time windows.
- Chunk — one time-range partition of a hypertable (here, one day); the unit that retention drops and that the planner prunes.
- Continuous aggregate — a materialized view over a hypertable that refreshes incrementally as data arrives, used to pre-roll
avg/min/max/lastsummaries. - Retention policy — a scheduled rule that drops chunks older than a set interval, expressed declaratively rather than as row deletes.
- Quality flag — a per-reading code (legacy OPC DA: 192 Good, 64 Uncertain, 0 Bad) recording how trustworthy the value is; first-class here, absent by default in OSS historians.
- Long (narrow) schema — one row per reading (
ts, tag, value, …) rather than one column per sensor; lets a new tag be data, not a migration. - TSL (Timescale License) — the source-available licence governing TimescaleDB's
tsl/features (Hypercore columnstore, native compression); not OSI open source, and deliberately unused here. - Swinging-door trending — the classic lossy historian compression algorithm; its deviation/deadband tolerance trades storage against reconstruction error and must be treated as a validated parameter.
time_bucket— the Apache-2.0 function that floors a timestamp to a fixed window (one minute, one hour); the time-series analogue ofGROUP BYand the grouping key of every continuous-aggregate row.- Rollup bucket — one summarised row of a continuous aggregate (
bucket, tag, avg/min/max/last) standing for many raw readings; keepingmin/maxbesideavgis what lets a brief excursion survive the summary. - RDF triple — the subject-predicate-object atom of a knowledge graph; the form one historian reading takes once its tag, unit, quality, and batch are made explicit facts (Chapter 19; Book 4).
- Competency question — a question a formal ontology must be able to answer (e.g. "every batch with a non-Good reading in Production"); a one-line SPARQL query once the tag is a typed property, a brittle string-parse against the flat table.
- SHACL
minCount— the closed-world constraint that a property must be present; the graph-native equivalent of thequality NOT NULLdiscipline this historian enforces. - Leave-one-batch-out cross-validation — a grouped split that holds out a whole campaign at once, keyed on
batch_id, so autocorrelated rows from one batch never leak across the train/test seam. - Applicability domain — the input region a model was calibrated on and can be trusted within; the
quality = 64excursion window is an out-of-domain region the quality flag lets a model exclude or flag. - Covariate vs concept drift — input-distribution movement (
P(X)) versus a change in the input-to-output mapping (P(Y|X)); a careless deadband erases the raw evidence the leading drift monitor needs to catch the former.
Where this leads
The historian now holds a faithful, retainable, quality-tagged river of readings — but every one of those readings is still mute about which step of which batch it belongs to. In Chapter 17 — Contextualization: Joining Time-Series to the Batch, we marry this ts.sensor_reading hypertable to the ISA-88/95 batch model from Chapter 4 with a single temporal-join view, so a reading stops being "37.04 °C at some instant" and becomes "37.04 °C during the Production phase of BATCH-2026-001 on BR101" — the moment raw data turns into process knowledge.