Perfecting the recipe (process development)
📍 Where we are: Stop 7 of 21 — we have our factory cell, and now we work out the best way to feed it, grow it, and purify the medicine it makes.
We finally have a cell that makes our antibody (a Y-shaped protein the immune system uses to grab onto specific targets) — the production cell line we built in Turning cells into factories. But a cell is only as good as the conditions we grow it in. Process development is the careful, systematic search for the best recipe — the right food, temperature, oxygen, and purification steps — so the cells stay healthy, make as much medicine as possible, and make the same medicine every single time.
Think of a chef opening a new restaurant. Before serving hundreds of guests, the chef perfects one dish in a test kitchen: a pinch more salt, a little less heat, cook it two minutes longer. They taste, tweak, and write down the winning recipe. Only then do they cook it for a full dining room. Process development is that test kitchen — for medicine. And because this is medicine, the chef also has to prove exactly which steps matter, and keep proving it for years.
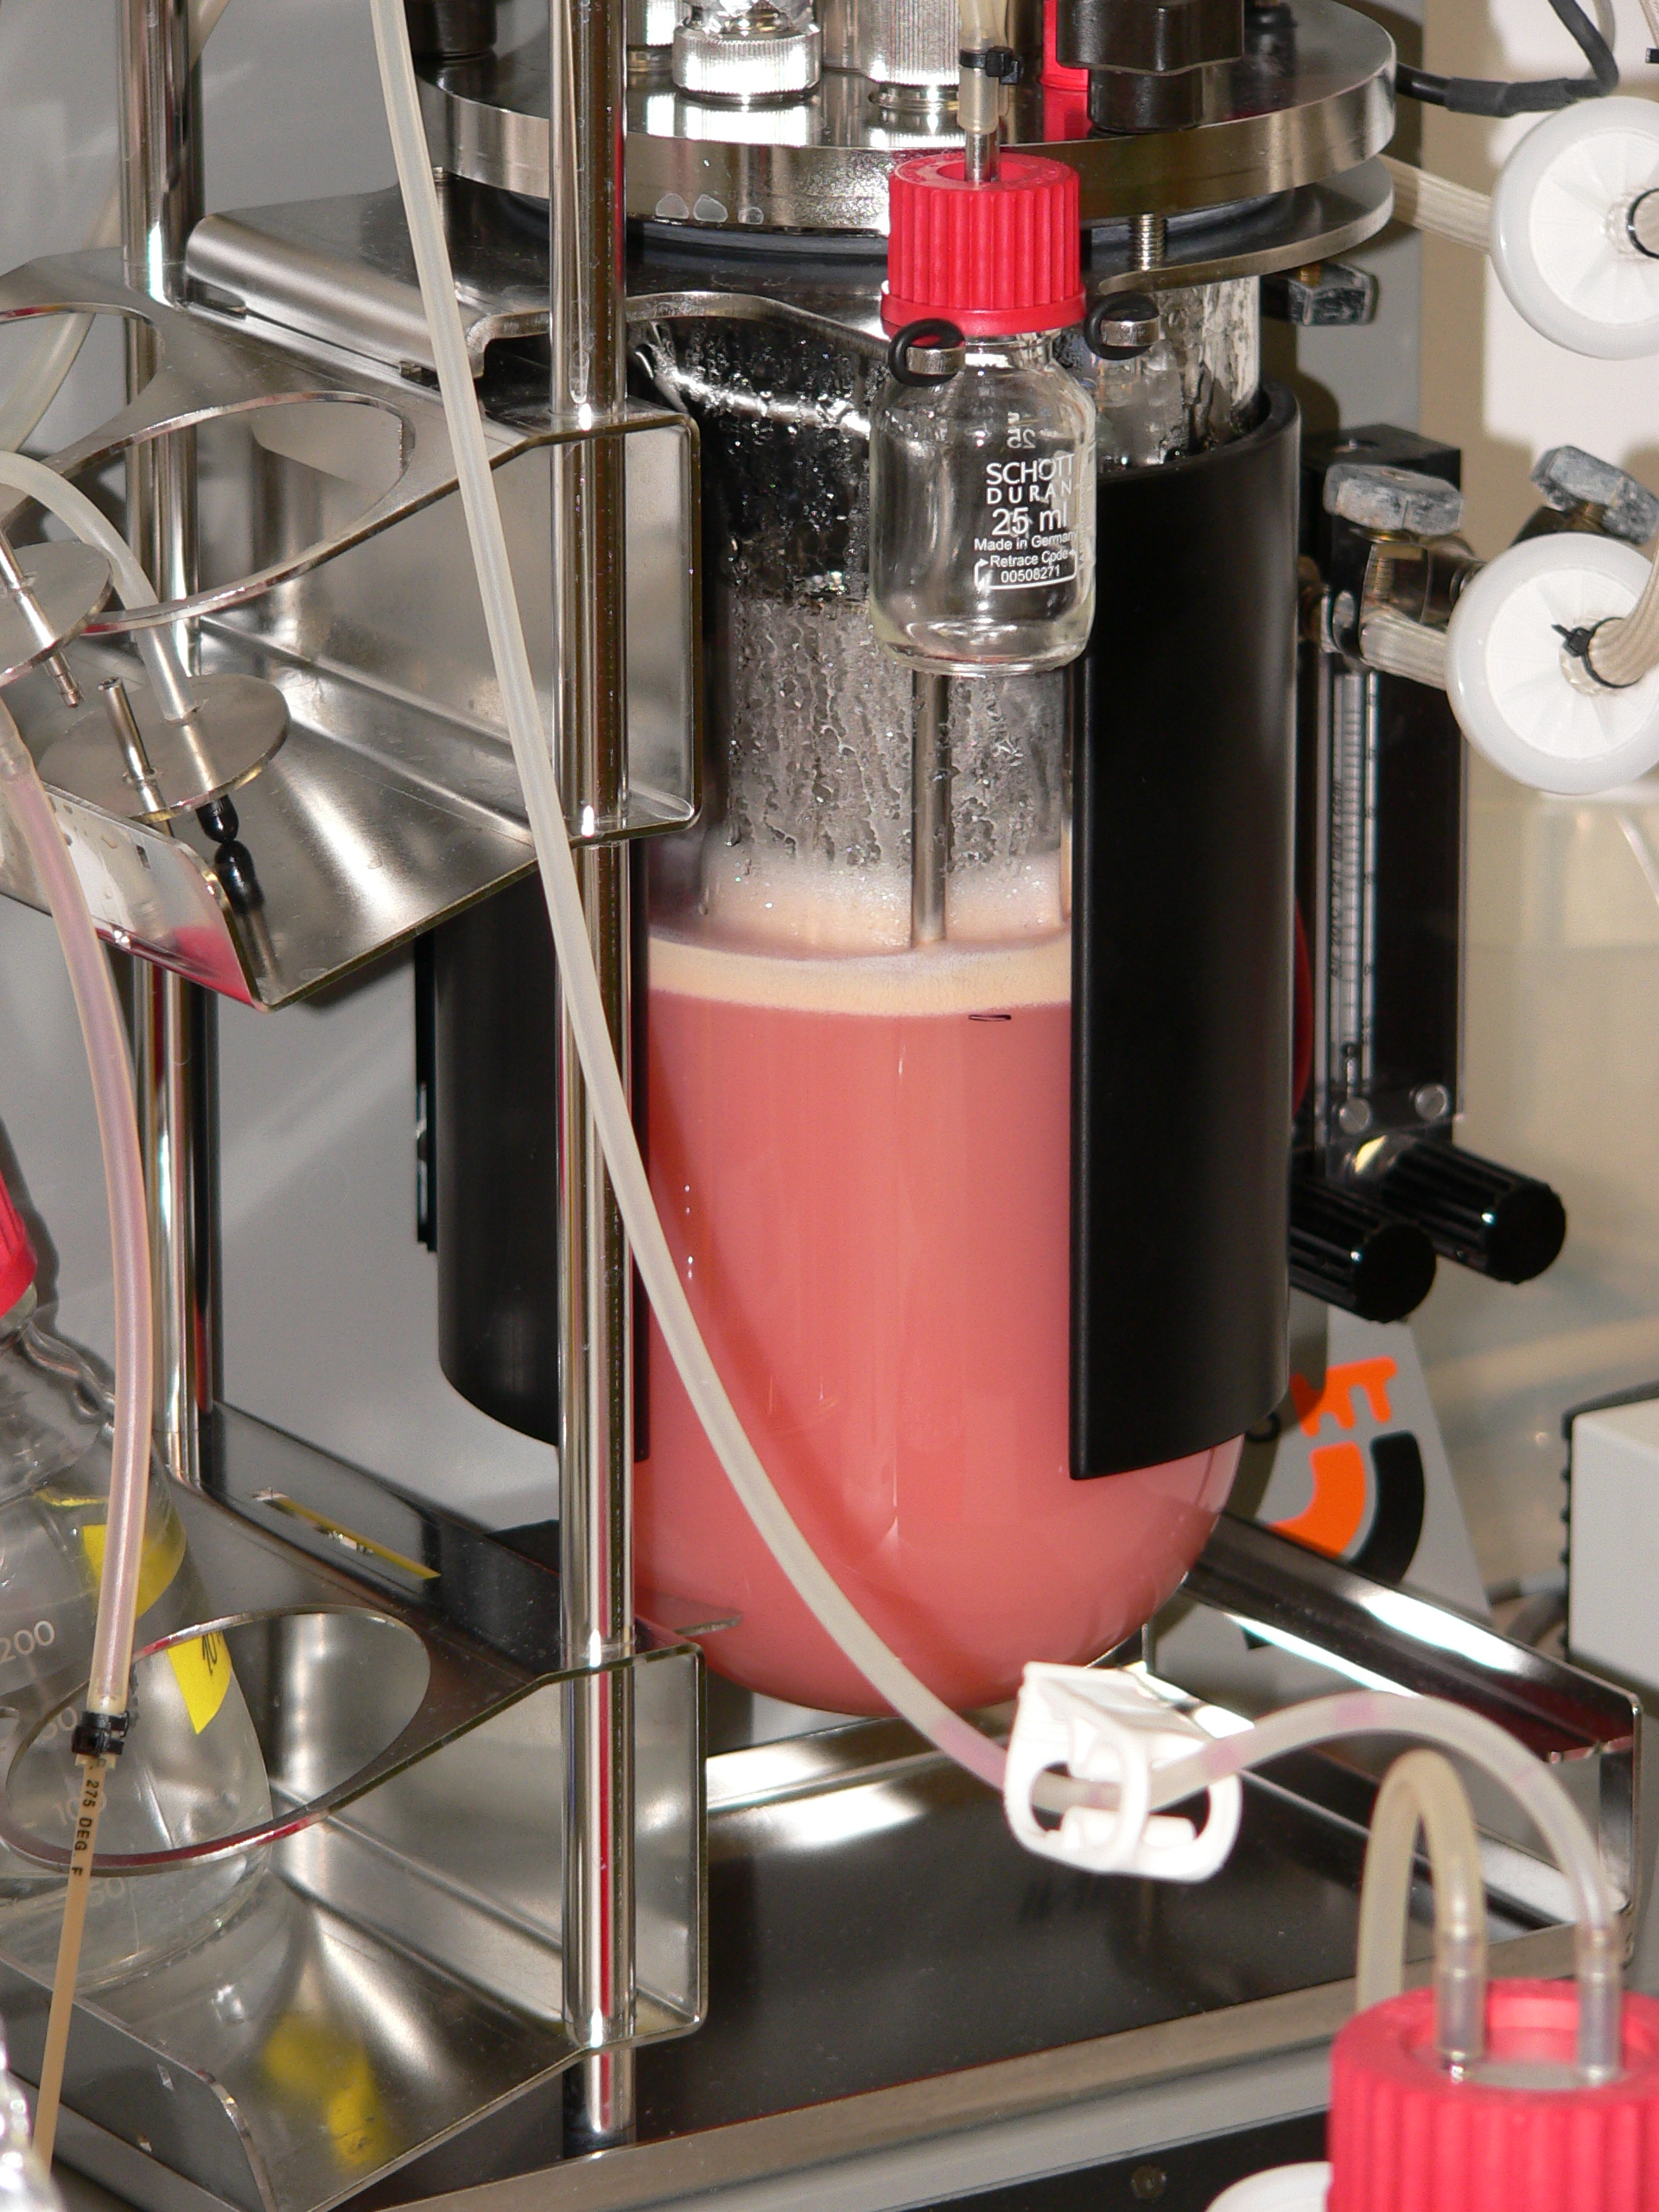 A benchtop bioreactor growing mammalian cells (the pink colour is the culture medium), where scientists fine-tune culture conditions at small scale before committing to large-scale manufacturing.
Benchtop bioreactor cultivating animal cells. Image by Karel Schmiedberger ml., CC BY 3.0, via Wikimedia Commons.
A benchtop bioreactor growing mammalian cells (the pink colour is the culture medium), where scientists fine-tune culture conditions at small scale before committing to large-scale manufacturing.
Benchtop bioreactor cultivating animal cells. Image by Karel Schmiedberger ml., CC BY 3.0, via Wikimedia Commons.
What this chapter covers
We will walk through the two halves of the work: upstream, where we grow the cells and coax them to make antibody, and downstream, where we pull that antibody out of the messy broth and clean it up. Along the way we will meet the smart experiment-planning method that saves years of lab time, the tiny robotic bioreactors that run dozens of recipes at once, and the small-scale "stunt doubles" that let a 2-litre flask predict what a 2,000-litre tank will do. Finally we will see why regulators care so deeply about this stage — because the recipe you lock in here becomes a legal promise.
What actually happens
The work splits into two halves, matching the two big stages of making a biologic.
Upstream: growing the cells
Scientists hunt for the conditions that keep cells thriving and productive:
- Media — the liquid "food" the cells live in. Modern cultures use chemically defined media (every ingredient known and measured, no animal-derived parts), sold under names like Gibco CD CHO, Cytiva HyClone, and Merck (MilliporeSigma) EX-CELL. A typical recipe carries glucose in the 5–10 g/L range as the main sugar, a balanced pool of amino acids (often in the low-millimolar range each — millimolar, mM, is a chemist's count of how many molecules are dissolved per litre, used here because amino acids are dosed by molecule rather than by weight), plus vitamins, trace metals, and buffering salts. Teams compare recipes to see which one their particular cell likes best.
- Feed strategy — when and how much extra nutrition to add as the cells multiply and get hungry. In a typical fed-batch run, concentrated feed is added every 24–48 hours, often triggered when a key nutrient runs low: glucose is topped up before it bottoms out, and glutamine (an amino acid the cells burn fast) is managed carefully because letting it run dry too early starves growth, while too much produces toxic ammonia.
- Temperature, pH, and dissolved oxygen (DO) — how warm, how acidic, and how much oxygen the liquid holds. CHO cells (the workhorse cell line from a Chinese hamster) are fussy, like a houseplant that wilts if you get any of these wrong. Cultures usually run near 37 °C, at pH 6.8–7.2, with dissolved oxygen held around 40–60 % of air saturation. Oxygen is maintained by a cascade: the system first speeds up the stirring impeller (often 50–150 rpm), and only then bubbles in more gas (0.1–0.5 vvm, meaning volumes of gas per volume of liquid per minute — so a 2,000 L tank at 0.1 vvm takes in about 200 L of gas a minute, a steady fine stream of bubbles rather than a rolling boil). If DO is allowed to fall below roughly 20 % of air saturation, the cells switch to a wasteful metabolism and dump out lactate, which sours the culture [3].
A single fed-batch culture typically runs 10–14 days and, for a well-developed platform mAb, reaches a titer of about 2–8 g/L (grams of antibody per litre of broth, with high-performing platforms reaching ~10 g/L) — though intensified processes now push higher [3].
DOE and scale-down screening
Testing all these variables one at a time would take forever, and it would miss the way settings interact (the best pH might depend on the temperature). So teams use Design of Experiments (DOE) — a structured plan that deliberately changes several settings at once and uses statistics to learn which ones truly matter and how they combine. A full factorial design (written 2^k for k two-level factors — two-level meaning each factor is tested at just two settings, a low and a high) tests every combination, which reveals every interaction but explodes as factors are added — eight runs for three factors, but over a thousand for ten. So when many factors must be screened, teams use a cheaper fractional factorial (2^(k–p), a clever subset of the full grid) or a Plackett-Burman design (an even more economical recipe that, for the same run budget, screens the most factors by giving up the ability to untangle their interactions), which bracket each factor between a low and a high value — say temperature 35–37 °C and pH 6.8–7.2 — to quickly spot the influential ones before zeroing in.
The payoff over one-factor-at-a-time is concrete: a 2^3 design is just eight runs, yet it reveals not only which factor matters but whether the best pH depends on the temperature — an interaction that changing one knob at a time can never see. The experiments are planned and analysed in dedicated software such as JMP Pro (from SAS), MODDE (from Sartorius), or Design-Expert (from Stat-Ease) [4]. A modern alternative goes one step further: instead of fixing the whole grid up front, a machine-learning method called Bayesian optimization fits a model to the runs done so far and lets it propose the next recipe to try, often reaching a good optimum in fewer experiments — the approach the machine-learning companion develops in its process-development chapter.
To actually run all those recipes, teams use rows of tiny automated bioreactors (a bioreactor is the vessel where cells grow). The Sartorius ambr 250 is an industry standard: each mini-bioreactor holds up to a 250 mL working volume (typically 100–250 mL), and a standard system runs 24 of them in parallel (a larger configuration handles 48), each with its own stirring, gassing, and pH control [4]. That is enough to evaluate two dozen genuinely different recipes in a single two-week run — a true high-throughput scale-down of the factory.
The three CPPs: temperature, pH, and dissolved oxygen
Three settings dominate every fed-batch recipe, and they behave differently. Temperature holds near 37 °C, but many platform processes deliberately shift it down to roughly 30–34 °C around the growth-to-production transition (often day 4–6) — a mild stress that arrests cells in the G0/G1 phase (the resting, non-dividing stage of the cell cycle), redirecting their energy from dividing to making protein, slowing nutrient burn and lactate, and shifting the antibody's glycosylation (its sugar pattern, a quality attribute tied to potency and to clearance — how quickly the body removes the drug from the bloodstream). The cost is fewer total cell-days, so the gain in per-cell productivity has to outweigh it. pH rides a narrow 6.8–7.2 band, held by sparging CO₂ to acidify and dosing a base to push back up. DO sits at 40–60 % of air saturation, defended by the stirring-then-sparge cascade described above. The production bioreactor at full scale defends these very same set-points with the very same loops, just on a 2,000-litre vessel.
Feed strategy and metabolite management
Feeding is not just topping up sugar. The real game is keeping the cells in a clean, efficient metabolic state. Glucose is held in a sensible band — too little starves the culture, too much pushes the cells to ferment it into lactate even when oxygen is plentiful (the so-called overflow metabolism). Glutamine is fed sparingly because the cells burn it fast and convert the excess into toxic ammonia. A well-tuned feed keeps lactate and ammonia low so the culture stays productive through to harvest. Each feed addition is a discrete event — a bolus dosed every 24–48 hours — and, as the figure below shows, those boluses pace the whole 14-day arc of cell growth, viability, and antibody accumulation.
 The same fed-batch culture read three ways across 14 days: viable cell density (top) peaks then falls, viability (middle) holds high before declining, and titer (bottom) keeps climbing — with feed boluses and the harvest point marked.
Original diagram by the authors, created with AI assistance.
The same fed-batch culture read three ways across 14 days: viable cell density (top) peaks then falls, viability (middle) holds high before declining, and titer (bottom) keeps climbing — with feed boluses and the harvest point marked.
Original diagram by the authors, created with AI assistance.
At-line analytics and the PAT framework
Throughout, scientists watch the culture using at-line analytics — pull a small sample and measure it on an instrument right next to the reactor, getting an answer in minutes rather than days. This is the heart of Process Analytical Technology (PAT), a quality-by-measurement framework the FDA formally encouraged in 2004 [7]. They track:
- VCD (viable cell density) — how many living cells there are per millilitre.
- Glucose — the cells' main sugar, their fuel.
- Lactate — a waste product; too much means the cells are stressed.
- Titer — how much antibody has been made so far.
Each of these measurements is born as a timestamped, tagged number. Taken together, all of those numbers form the batch's data shadow — the complete digital record that tracks the physical material in parallel, capturing everything that happened to it. This book follows the physical sample; its companion volume follows what happens to that number once it leaves the probe — see where each data point is born and how it joins the batch's data shadow in the data-management book.

Anatomy of one CPP
A critical process parameter is never just a number on a screen. It is a small bundle of commitments: a target, a proven operating band, a biological rationale for caring, a measurement mechanism that watches it, and a drift-triggered control action that pulls it back. Dissolved oxygen makes the cleanest example. Its target is 40–60 % of air saturation, its band is ±10 %, its rationale is that cells need oxygen to grow and fold protein, its measurement is an in-line DO probe reading continuously, and its control action is the stirring-then-sparge cascade. Lay all of that out and the parameter reads like an identity card.
That identity card is also the seed of a formal model. A CPP "is a kind of" process parameter, it "controls" a quality attribute, and it "is measured by" a probe — and each of those phrases is a typed relationship, an edge that links one defined thing to another. Writing those edges down precisely (so a computer, not just a person, can follow them) is the job of an ontology — a shared, machine-readable vocabulary of the things in a process and how they connect; the ontology companion builds exactly these CPP-to-CQA edges in its chapter on relations and genealogy.
 A single CPP — dissolved oxygen — as a recipe identity card: target, operating band, rationale, measurement, and the drift-triggered control cascade, with its siblings (temperature, pH) and the forward chain into data and code.
Original diagram by the authors, created with AI assistance.
A single CPP — dissolved oxygen — as a recipe identity card: target, operating band, rationale, measurement, and the drift-triggered control cascade, with its siblings (temperature, pH) and the forward chain into data and code.
Original diagram by the authors, created with AI assistance.
That same DO loop, expressed as concrete configuration rows and control code, is exactly what the open-source companion builds in the upstream bioreactor chapter: the physical set-point here becomes a recipe_parameter row and a PID control cascade there (PID — proportional-integral-derivative — is the standard controller that nudges a reading back to its set-point).
Downstream: the platform purification template
A second team works out how to pull the pure antibody out of the harvested broth — a soup containing the antibody alongside dead cells, cell debris, DNA, and thousands of other proteins. They use columns (tubes packed with sticky beads, or resin) and buffers (carefully mixed salt-and-water solutions) to catch the antibody, wash everything else away, and release it clean.
The first and most important step is the capture column, and for antibodies it is almost always Protein A chromatography. Protein A is a bacterial protein that grabs the constant "stem" of an antibody with exquisite specificity, so it plucks the mAb out of the broth while letting nearly everything else flow past. Modern alkali-stable resins such as Cytiva MabSelect (originally a GE Healthcare product) or Thermo Fisher POROS bind on the order of 40–80 grams of antibody per litre of resin (their dynamic binding capacity, DBC — first-generation rProtein A managed only 10–20 g/L). Protein A is a bind-and-elute step: the antibody sticks while impurities flow past, then the captured antibody is released by switching to an acidic buffer at about pH 3.2–3.5. That low-pH step does double duty: it elutes the product and inactivates many enveloped viruses, so it counts as the first dedicated viral safety step in the purification chain [5].
After capture come one or two polishing columns, typically ion-exchange (which sorts molecules by electric charge) and sometimes hydrophobic-interaction chromatography (which sorts by "oiliness"). The logic is orthogonality: each step clears a different impurity class by a different mechanism, so what one column lets slip, the next catches. A common pairing runs cation exchange in bind-and-elute mode (the product sticks, charge-variant impurities wash off) followed by anion exchange in flow-through mode (the product flows past while DNA and residual viruses stick to the column). These do the fine cleaning, driving impurities down to tiny, regulated levels. Three impurity classes each carry a target number and a named assay that proves it is met:
| Impurity to remove | Typical target | How it is measured |
|---|---|---|
| Host cell proteins (HCPs) — leftover CHO proteins | Below a few parts per million | ELISA (an antibody-based lab test); the compendial method — meaning an officially recognized standard procedure — is USP General Chapter <1132> [8], published by the U.S. Pharmacopeia, the body whose methods regulators accept |
| Residual DNA | Below roughly 10 ng per dose (the long-standing WHO/regulatory guideline; modern processes routinely reach picogram levels) | qPCR (a DNA-copying assay that counts DNA) |
| Aggregates — clumped high-molecular-weight antibody | Under about 0.5–1 % [5] | Size-exclusion chromatography (SEC-HPLC) |
The aggregate level seen at an early step (~1 %) is tightened toward under 0.5 % in the released drug substance. Charge variants (acidic and basic species from deamidation — a small chemical change that converts one amino acid into a slightly more acidic one — and other modifications) are a further quality attribute, profiled separately. Viral safety, too, is a sum: the low-pH Protein A inactivation and a dedicated nanofiltration step give two orthogonal barriers, and the log-reduction values (LRVs) of each step — each LRV the number of factors of ten a step removes, so an LRV of 4 means a ten-thousand-fold reduction — are added to prove the required total clearance. Because LRVs are base-10 logarithms, adding them multiplies the actual fold-reductions (a 4-log inactivation followed by a 4-log filtration gives 8 logs, i.e. a hundred-million-fold reduction overall), which is the whole reason two orthogonal barriers are stacked. Regulators (under ICH Q5A, the guideline on viral safety) expect that combined clearance to exceed the worst-case viral load by a wide safety margin before the batch can be released. This capture-plus-polish sequence is so well established that the industry calls it a platform process: a proven template you adapt to each new antibody rather than reinventing from scratch. The same column-load-wash-elute logic, expressed as configurable steps and gradients, is implemented in the open-source downstream chromatography chapter.
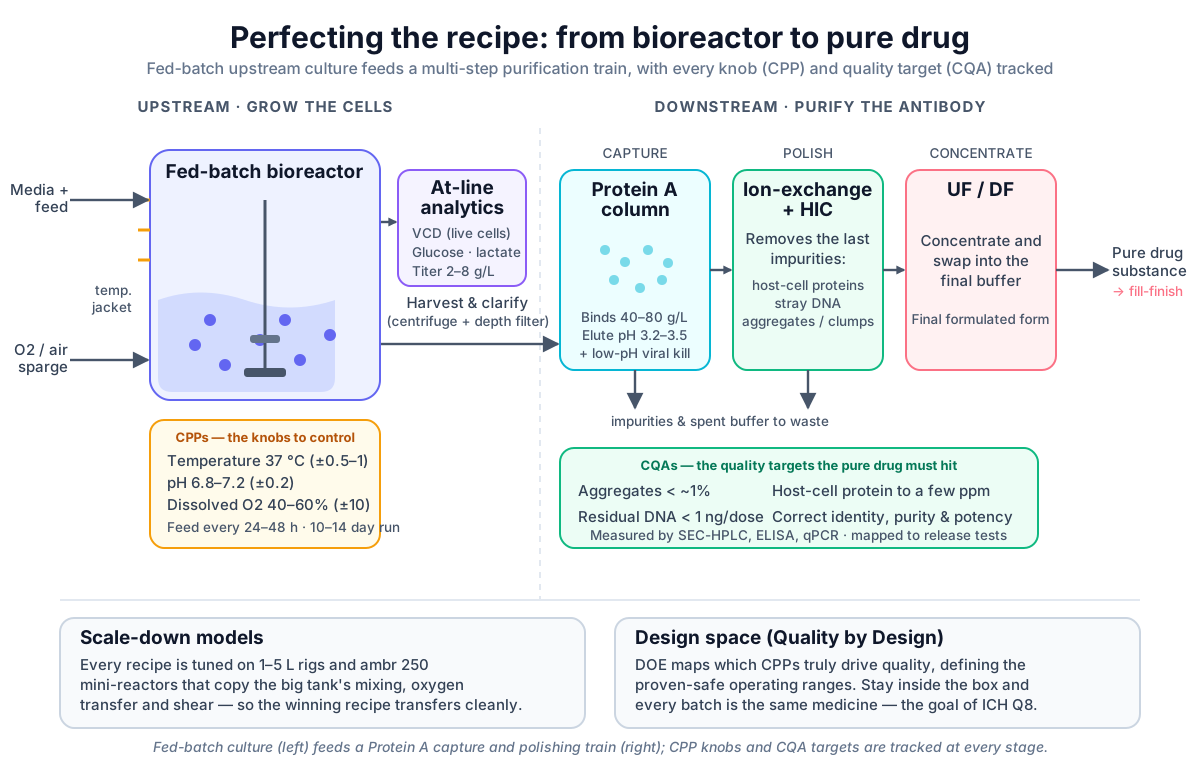 Typical mAb manufacturing process development pathway: fed-batch culture (left) with key parameters monitored, connected to multi-step chromatography capture and polishing (right). Arrows indicate material flow; callout boxes show CQAs and CPPs tracked at each stage.
Original diagram by the authors, created with AI assistance.
Typical mAb manufacturing process development pathway: fed-batch culture (left) with key parameters monitored, connected to multi-step chromatography capture and polishing (right). Arrows indicate material flow; callout boxes show CQAs and CPPs tracked at each stage.
Original diagram by the authors, created with AI assistance.
Scale-down model fidelity: the stunt doubles
There is a catch hiding behind all of this. The real factory tank can hold 1,000–2,000 litres or more, but you cannot afford to run experiments at that size — a single full-scale batch is wildly expensive and ties up a plant. So nearly all of this development happens in scale-down models: small 1–5 L bench bioreactors (and the even smaller ambr units) deliberately tuned to behave like the big tank [4].
"Tuned to behave like" is doing a lot of work in that sentence, so here is what it actually means. Cells in a giant tank and cells in a flask experience the same chemistry but very different physics. Engineers match the models by keeping a few key quantities equal across scales: the power the impeller puts into each litre of liquid (which sets how hard the cells get sheared by the stirring), the oxygen-transfer rate (captured by a number called k_La, how fast oxygen dissolves from bubbles into the liquid), the mixing time (how long it takes to blend an added feed), and the residence time that fluid spends in each part of the system. The matching is mostly empirical — engineers measure these quantities directly and adjust impeller speed, vessel shape, and gas flow until the small rig and the big tank agree — though computational fluid dynamics (CFD), which simulates the swirling flow on a computer, is increasingly used to predict trouble spots before they happen [3]. Get the small model honest, and the recipe transfers cleanly to full size during tech transfer (the formal hand-off of a process to the manufacturing plant). At the receiving plant the equipment itself is proven fit through formal qualification — installation, operational, and performance qualification (IQ/OQ/PQ): IQ confirms the tank and its sensors are installed as specified, OQ that they perform across their operating ranges, and PQ that the whole line makes good product run after run — before any drug for patients is made.
Why it matters
A shaky recipe means an unreliable medicine. Too little food and the cells starve, so titer drops and each batch makes less drug. The wrong pH or oxygen can stress the cells into making protein that is misfolded or clumped into aggregates — exactly the kind of defect that can be unsafe for a patient, which is why aggregates are kept under tight limits. A weak purification step can leave behind host cell proteins that may trigger immune reactions in people.
Process development is also where scientists learn which settings are the critical process parameters (CPPs) — the knobs that, if they drift, change the medicine's quality. Once a CPP is identified, the process is run inside a proven operating range — for a mature mAb process these are often on the order of pH ± 0.2 units, temperature ± 0.5–1 °C, and DO ± 10 % around the target. Knowing these ranges is what lets the factory make the same safe drug, batch after batch, for years.
| Critical process parameter | Target | Operating range | What happens if it drifts |
|---|---|---|---|
| Temperature | ~37 °C | ± 0.5–1 °C | Cells stress and misfold protein |
| pH | 6.8–7.2 | ± 0.2 units | Stress pushes cells to make aggregates |
| Dissolved oxygen (DO) | 40–60 % of air saturation | ± 10 % | Below ~20 %, cells switch to a wasteful metabolism and dump lactate, souring the culture |
QbD and the design space
This whole way of working has a name: Quality by Design (QbD) — building quality into the process by understanding it deeply, rather than testing it in at the end. Its single most important distinction is this: CPPs are the knobs you set (temperature, pH, DO, feed), while CQAs — critical quality attributes — are the properties of the molecule you measure (glycosylation, charge variants, aggregates, HCP, residual DNA); QbD is the work of learning which knob moves which property. The cluster of CPP settings that reliably yields good product is called the design space, a term formally defined in the international guideline ICH Q8(R2) [1]. Picture each CPP as one axis of a box — temperature, pH, DO — with the design space as the safe interior: stay inside any combination of settings within it and the product is good, and the operating ranges in the table above are the box's walls. Crucially the design space is multidimensional and accounts for how factors interact, which is exactly why DOE — not one-factor-at-a-time — is needed to map it. The landmark idea that QbD, DOE, and CPP-to-quality links should reshape biologics development was laid out in an influential 2009 review by Rathore and Winkle [2], and the entire approach is illustrated end-to-end in the industry's famous worked example, the A-Mab case study [9]. All of this work goes hand in hand with measuring quality and stability, because you can only improve — and only prove — what you can measure.
When the recipe fails
A control strategy is best understood by watching it break. Two failure modes recur often enough that every process-development team plans for them.
The first is loss of DO control. If the cascade can no longer hold dissolved oxygen — a sparger fouls, a gas line restricts, or demand simply outruns supply at peak cell density — DO sags below the ~20 % floor and the culture flips into anaerobic, lactate-producing metabolism [3]. Lactate acidifies the broth, which forces the pH controller to dose more base, which shifts osmolality, which stresses the cells further. One slipping parameter becomes a small avalanche: the failure modes aggregate, each one widening the next. Caught early on the at-line trend, it is recoverable; caught late, the batch can be lost. This is precisely why the operating bands are defended so tightly, and why ICH Q8(R2) frames the design space as the region where these interactions stay benign [1].
The second failure mode is quieter and, in a regulated plant, more insidious: a single drifting probe corrupts the record. Suppose the DO probe itself drifts — it reads 45 % while the true value is 30 %. The controller, trusting the probe, eases off the cascade exactly when it should push harder. The cells suffer the real low-DO stress while the logged data looks perfect. Now the manufacturing record is not just wrong, it is confidently wrong — and because that record is the legal evidence the batch was made in control, a corrupted measurement is a data-integrity problem as much as a process problem. Regulators address this with explicit frameworks — the ALCOA+ principles that a record be Attributable, Legible, Contemporaneous, Original, and Accurate; FDA 21 CFR Part 11 and EU Annex 11 on trustworthy electronic records; and the shift from heavy computer system validation (CSV) toward risk-based computer software assurance (CSA) — all developed in the data-management book's chapters on data integrity and ALCOA+, Part 11 and Annex 11, and CSV to CSA. The open-source companion walks through a related worked day-7 excursion — a brief cooling dip during which the DO probe is honestly flagged Uncertain — and, separately, the probe-drift failure mode itself, in the upstream bioreactor chapter, showing how a flagged or drifting reading propagates from probe to historian (the time-series database that stores plant-floor signals) to batch record. The deeper lesson — that a control loop is only as trustworthy as the sensor feeding it — is taken up in the data-management book's chapter on automation and control data.
In the real world
The baseline commercial recipe, and still the way most approved antibodies are made, is fed-batch culture: grow the cells in one big tank, feed them along the way, then harvest once. The modern, intensified direction is integrated continuous manufacturing — a perfusion bioreactor where fresh media flows in and product flows out continuously, paired with multi-column capture (also called periodic counter-current, or PCC, chromatography): several small Protein A columns run on a staggered cycle — while one is being washed and eluted, the continuous product stream is diverted onto the next, so a column is always capturing instead of sitting idle between batches, and the costly Protein A resin is used around the clock. Continuous processing keeps cells productive far longer and shrinks the equipment footprint; large companies such as Amgen and Regeneron have invested heavily in these systems, and it is widely seen as the future. But it is the emerging variant, not yet the norm — fed-batch plus Protein A remains the workhorse of the approved-product world.
The numbers and ranges throughout this chapter are not arbitrary; they trace back to formal expectations. When a process moves from the bench into a regulatory filing, the CPPs and the control strategy worked out here become the documented commitments in the drug-substance section of the IND (Investigational New Drug application) and later the BLA (Biologics License Application), following the development-and-manufacture guideline ICH Q11 [6]. From the moment material is made for human use, that locked recipe is executed under cGMP (current Good Manufacturing Practice — the FDA's enforceable rules for making medicines safely and consistently). In other words, the recipe you perfect in the test kitchen turns into a legal promise about how every future batch will be made.
Key terms
- Process development — the systematic search for the best recipe and steps to grow cells and purify the drug, and to prove which settings matter.
- Media — the liquid food the cells live in; modern versions are chemically defined (every ingredient known).
- Feed strategy — the plan for adding extra nutrients during the culture (in fed-batch, typically every 24–48 hours).
- Dissolved oxygen (DO) — how much oxygen is held in the liquid; CHO cultures are usually held at 40–60 % of saturation.
- Design of Experiments (DOE) — a structured statistical plan to test many variables (and their interactions) at once.
- Bayesian optimization — a machine-learning method that fits a model to the runs done so far and proposes the next recipe to try, often finding a good optimum in fewer experiments than a fixed grid.
- ambr 250 — a Sartorius system of small automated bioreactors (up to 250 mL working volume each, typically 100–250 mL; 24 or 48 in parallel) run side by side.
- At-line analytics — measuring a pulled sample on an instrument beside the reactor, within minutes.
- VCD (viable cell density) — how many living cells are in the culture.
- Titer — how much antibody the cells have made (often 2–8 g/L for a platform fed-batch mAb, with high-performing platforms reaching ~10 g/L).
- Scale-down model — a small 1–5 L rig tuned (by matching shear, oxygen transfer, and mixing) to mimic the full-size tank.
- IQ/OQ/PQ qualification — the formal proof that plant equipment is installed (IQ), operates across its ranges (OQ), and consistently makes good product (PQ) before drug for patients is made.
- CPP (critical process parameter) — a setting that changes drug quality if it drifts, so it is held in a proven range.
- Quality by Design (QbD) — building quality into a process through deep understanding, not end-of-line testing.
- Design space — the proven combination of CPP settings that reliably yields good product (defined in ICH Q8(R2)).
- Protein A chromatography — the capture step that selectively grabs antibodies from the broth.
- Polishing — the ion-exchange and hydrophobic-interaction columns that drive impurities (HCP, DNA, aggregates) to tiny levels.
- HCP (host cell protein) — leftover proteins from the production cell, kept to a few parts per million.
- Aggregates — clumped antibodies, a safety concern, kept below about 1 %.
- DO cascade — the layered control loop that holds dissolved oxygen: raise impeller speed first, then open the gas sparge.
- Overflow metabolism — when cells ferment glucose into lactate even with oxygen present, a sign of too-rich feeding or low DO.
- PAT (Process Analytical Technology) — the FDA-encouraged framework of measuring quality in real time rather than testing it in at the end.
- Data shadow — the complete digital record of every measurement and event for a batch, tracking the physical material in parallel.
- ALCOA+ — the data-integrity principles that a record be Attributable, Legible, Contemporaneous, Original, and Accurate (plus complete, consistent, enduring, and available).
- Ontology — a shared, machine-readable vocabulary of the things in a process and the typed relationships between them.
- Fed-batch — the baseline culture mode: one tank, fed along the way, harvested once.
- Perfusion / continuous — the intensified mode: media flows in and product flows out continuously, often with multi-column capture.
- cGMP — current Good Manufacturing Practice, the FDA's enforceable rules for making medicines safely and consistently.
Where this leads
A perfected recipe is only half the story — you still have to prove the antibody is what you think it is, pure enough, and stable in its final vial. Next, in Measuring quality and keeping the protein stable, we meet the tests and formulation science that turn a purified protein into a safe, shelf-stable dose for a patient.